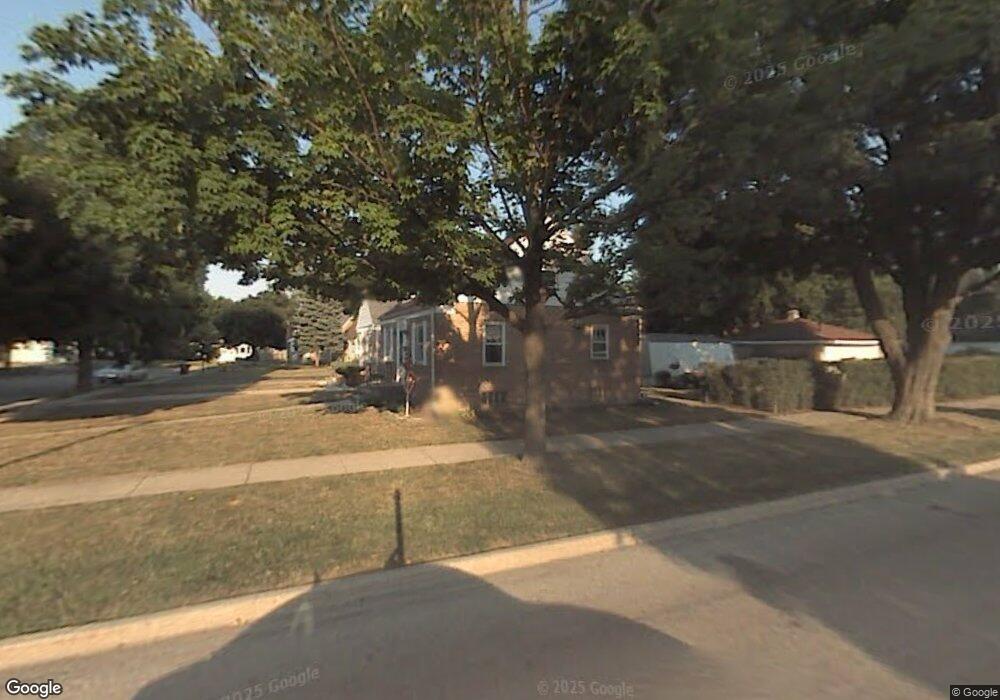
1023 Fairfield Ct Waukegan, IL 60085
Estimated Value: $215,000 - $237,423
3
Beds
2
Baths
1,170
Sq Ft
$194/Sq Ft
Est. Value
About This Home
This home is located at 1023 Fairfield Ct, Waukegan, IL 60085 and is currently estimated at $226,606, approximately $193 per square foot. 1023 Fairfield Ct is a home located in Lake County with nearby schools including Glen Flora Elementary School, Edith M Smith Middle School, and Waukegan High School.
Ownership History
Date
Name
Owned For
Owner Type
Purchase Details
Closed on
May 16, 2025
Sold by
Gray Bensaiah Akbar and Gray Melissa Kristine
Bought by
Gray Melissa Kristine
Current Estimated Value
Purchase Details
Closed on
Feb 22, 2021
Sold by
Knop Melissa K and Gray Bensaiah
Bought by
Gray Bensaiah and Gray Melissa K
Home Financials for this Owner
Home Financials are based on the most recent Mortgage that was taken out on this home.
Original Mortgage
$119,963
Interest Rate
3.25%
Mortgage Type
FHA
Purchase Details
Closed on
Jul 23, 2018
Sold by
Barrios Margaret Zinn
Bought by
Gray Bensaiah and Knop Melissa K
Home Financials for this Owner
Home Financials are based on the most recent Mortgage that was taken out on this home.
Original Mortgage
$112,128
Interest Rate
5.5%
Mortgage Type
FHA
Create a Home Valuation Report for This Property
The Home Valuation Report is an in-depth analysis detailing your home's value as well as a comparison with similar homes in the area
Home Values in the Area
Average Home Value in this Area
Purchase History
| Date | Buyer | Sale Price | Title Company |
|---|---|---|---|
| Gray Melissa Kristine | -- | None Listed On Document | |
| Gray Bensaiah | -- | New Title Company Name | |
| Gray Bensaiah | $116,000 | First American Title |
Source: Public Records
Mortgage History
| Date | Status | Borrower | Loan Amount |
|---|---|---|---|
| Previous Owner | Gray Bensaiah | $119,963 | |
| Previous Owner | Gray Bensaiah | $112,128 |
Source: Public Records
Tax History Compared to Growth
Tax History
| Year | Tax Paid | Tax Assessment Tax Assessment Total Assessment is a certain percentage of the fair market value that is determined by local assessors to be the total taxable value of land and additions on the property. | Land | Improvement |
|---|---|---|---|---|
| 2024 | $4,244 | $58,848 | $9,472 | $49,376 |
| 2023 | $4,590 | $53,011 | $8,480 | $44,531 |
| 2022 | $4,590 | $52,951 | $7,343 | $45,608 |
| 2021 | $4,109 | $45,413 | $6,549 | $38,864 |
| 2020 | $4,116 | $42,307 | $6,101 | $36,206 |
| 2019 | $4,089 | $38,768 | $5,591 | $33,177 |
| 2018 | $2,911 | $38,267 | $7,123 | $31,144 |
| 2017 | $2,204 | $33,856 | $6,302 | $27,554 |
| 2016 | $2,394 | $29,419 | $5,476 | $23,943 |
| 2015 | $2,590 | $26,330 | $4,901 | $21,429 |
| 2014 | $2,419 | $24,451 | $5,111 | $19,340 |
| 2012 | $3,046 | $26,492 | $5,538 | $20,954 |
Source: Public Records
Map
Nearby Homes
- 917 N Linden Ave
- 1000 Pine St
- 1105 Woodlawn Cir
- 824 N Butrick St
- 918 N Ash St
- 1110 N Ash St
- 1122 N Ash St
- 1504 W Glen Flora Ave
- 1117 Judge Ave
- 968 Judge Ave
- 1335 Chestnut St
- 1336 N Ash St
- 620 N Poplar St
- 702 Franklin St
- 1038 Indiana Ave
- 522 N Poplar St
- 415 W Ridgeland Ave
- 511 Chestnut St
- 509 N Butrick St
- 1018 W Atlantic Ave
- 1019 Fairfield Ct
- 1015 Fairfield Ct
- 1101 Fairfield Cir
- 1020 W Ridgeland Ave
- 1011 Fairfield Ct
- 1014 W Ridgeland Ave
- 1105 Fairfield Cir
- 1102 W Ridgeland Ave
- 1010 W Ridgeland Ave
- 1007 W Fairfield Ct
- 1024 Fairfield Ct
- 1020 Fairfield Ct
- 1016 Fairfield Ct
- 1006 W Ridgeland Ave
- 1007 Fairfield Ct
- 1102 Fairfield Cir
- 1109 Fairfield Cir
- 1113 Fairfield Cir
- 1005 Fairfield Ct
- 928 W Ridgeland Ave