Estimated Value: $374,504 - $403,000
4
Beds
2
Baths
2,108
Sq Ft
$187/Sq Ft
Est. Value
About This Home
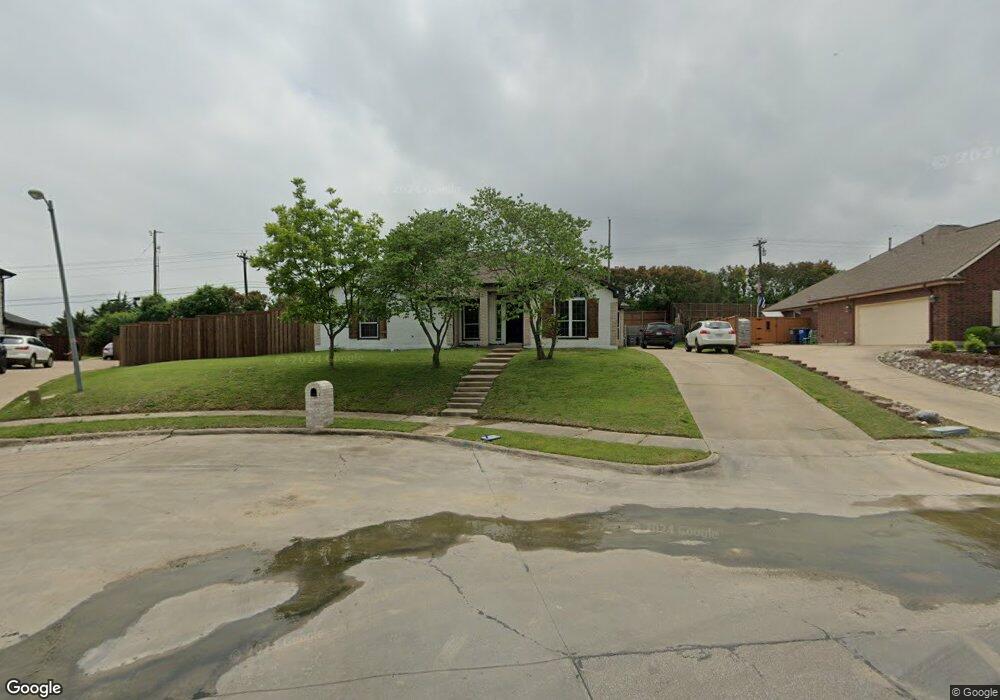
This home is located at 1023 Foxwood Ln, Wylie, TX 75098 and is currently estimated at $394,626, approximately $187 per square foot. 1023 Foxwood Ln is a home located in Collin County with nearby schools including P M Akin Elementary School, AB Harrison Intermediate School, and Grady Burnett J High School.
Ownership History
Date
Name
Owned For
Owner Type
Purchase Details
Closed on
Oct 22, 2020
Sold by
Knackstadt John W and Knackstadt Miryam E
Bought by
Samano Robert
Current Estimated Value
Home Financials for this Owner
Home Financials are based on the most recent Mortgage that was taken out on this home.
Original Mortgage
$242,250
Outstanding Balance
$215,076
Interest Rate
2.8%
Mortgage Type
New Conventional
Estimated Equity
$179,550
Purchase Details
Closed on
Jan 13, 1999
Sold by
Choice Homes Texas Inc
Bought by
Knackstadt John W and Knackstadt Miryam E
Purchase Details
Closed on
May 14, 1998
Sold by
First State Bank Wylie
Bought by
Choice Homes Texas Inc
Home Financials for this Owner
Home Financials are based on the most recent Mortgage that was taken out on this home.
Original Mortgage
$6,500,000
Interest Rate
7.09%
Mortgage Type
Construction
Create a Home Valuation Report for This Property
The Home Valuation Report is an in-depth analysis detailing your home's value as well as a comparison with similar homes in the area
Home Values in the Area
Average Home Value in this Area
Purchase History
| Date | Buyer | Sale Price | Title Company |
|---|---|---|---|
| Samano Robert | -- | None Available | |
| Knackstadt John W | -- | -- | |
| Choice Homes Texas Inc | -- | Commonwealth Land Title Co |
Source: Public Records
Mortgage History
| Date | Status | Borrower | Loan Amount |
|---|---|---|---|
| Open | Samano Robert | $242,250 | |
| Previous Owner | Choice Homes Texas Inc | $6,500,000 |
Source: Public Records
Tax History Compared to Growth
Tax History
| Year | Tax Paid | Tax Assessment Tax Assessment Total Assessment is a certain percentage of the fair market value that is determined by local assessors to be the total taxable value of land and additions on the property. | Land | Improvement |
|---|---|---|---|---|
| 2025 | $5,412 | $365,815 | $114,000 | $251,815 |
| 2024 | $5,412 | $339,513 | $114,000 | $239,668 |
| 2023 | $5,412 | $308,648 | $114,000 | $265,411 |
| 2022 | $6,156 | $280,589 | $114,000 | $269,462 |
| 2021 | $6,002 | $255,081 | $66,500 | $188,581 |
| 2020 | $6,336 | $262,108 | $66,500 | $195,608 |
| 2019 | $6,096 | $231,977 | $66,500 | $190,384 |
| 2018 | $5,679 | $210,888 | $66,500 | $173,261 |
| 2017 | $5,163 | $211,133 | $57,000 | $154,133 |
| 2016 | $4,843 | $191,603 | $39,900 | $151,703 |
| 2015 | $3,008 | $158,443 | $39,900 | $118,543 |
Source: Public Records
Map
Nearby Homes
- 1201 E Stone Rd
- 1320 Cedar Branch Dr
- 1318 Chestnut Hill Dr
- 1321 Iron Horse St
- 407 Sparrow Dr
- 312 Maltese Cir
- 306 Foxwood Ct
- 1210 Iron Horse St
- 1323 Canyon Creek Rd
- 1115 Nighthawk Dr
- 1209 Surrey Cir
- 1330 Canyon Creek Rd
- 1210 Troy Rd
- 1316 Taren Trail
- 1318 Taren Trail
- 825 Forest Edge Ln
- 1503 E Collins Blvd
- 409 Cedar Ridge Dr
- 825 Foxwood Ln
- 820 Foxwood Ln
- 1021 Foxwood Ln
- 513 Foxwood Ln
- 511 Foxwood Ln
- 1019 Foxwood Ln
- 1022 Foxwood Ln
- 1319 Clear Creek Dr
- 1317 Clear Creek Dr
- 1321 Clear Creek Dr
- 1020 Foxwood Ln
- 1315 Clear Creek Dr
- 1323 Clear Creek Dr
- 1325 Clear Creek Dr
- 1017 Foxwood Ln
- 1327 Clear Creek Dr
- 504 Foxwood Ln
- 1018 Foxwood Ln
- 509 Foxwood Ln
- 1310 E Stone Rd
- 1329 Clear Creek Dr
- 1331 Clear Creek Dr