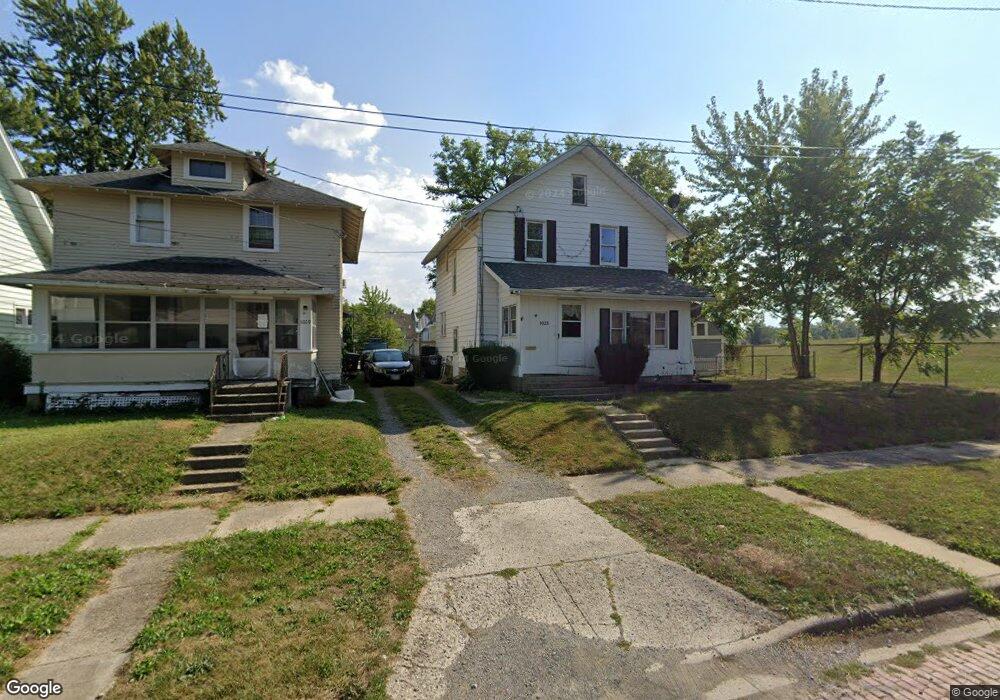
1023 Hazel Ave Lima, OH 45805
Central Lima NeighborhoodEstimated Value: $68,000 - $82,000
3
Beds
1
Bath
1,344
Sq Ft
$57/Sq Ft
Est. Value
About This Home
This home is located at 1023 Hazel Ave, Lima, OH 45805 and is currently estimated at $76,333, approximately $56 per square foot. 1023 Hazel Ave is a home located in Allen County with nearby schools including Heritage Elementary School, Lima North Middle School, and Lima West Middle School.
Ownership History
Date
Name
Owned For
Owner Type
Purchase Details
Closed on
Jan 11, 2008
Sold by
Vision 1 Investments Llc
Bought by
Vision 2 Investments Llc
Current Estimated Value
Purchase Details
Closed on
May 23, 2007
Sold by
Hendricks Denise
Bought by
Vision 1 Investments Llc
Purchase Details
Closed on
Dec 19, 1989
Bought by
Hendricks Denise
Create a Home Valuation Report for This Property
The Home Valuation Report is an in-depth analysis detailing your home's value as well as a comparison with similar homes in the area
Home Values in the Area
Average Home Value in this Area
Purchase History
| Date | Buyer | Sale Price | Title Company |
|---|---|---|---|
| Vision 2 Investments Llc | -- | Attorney | |
| Vision 1 Investments Llc | $34,000 | None Available | |
| Hendricks Denise | $31,000 | -- |
Source: Public Records
Tax History
| Year | Tax Paid | Tax Assessment Tax Assessment Total Assessment is a certain percentage of the fair market value that is determined by local assessors to be the total taxable value of land and additions on the property. | Land | Improvement |
|---|---|---|---|---|
| 2024 | $759 | $19,780 | $2,210 | $17,570 |
| 2023 | $740 | $16,810 | $1,930 | $14,880 |
| 2022 | $743 | $16,810 | $1,930 | $14,880 |
| 2021 | $787 | $16,810 | $1,930 | $14,880 |
| 2020 | $743 | $14,010 | $1,860 | $12,150 |
| 2019 | $743 | $14,010 | $1,860 | $12,150 |
| 2018 | $741 | $14,010 | $1,860 | $12,150 |
| 2017 | $746 | $14,010 | $1,860 | $12,150 |
| 2016 | $756 | $14,010 | $1,860 | $12,150 |
| 2015 | $795 | $14,010 | $1,860 | $12,150 |
| 2014 | $795 | $14,560 | $1,960 | $12,600 |
| 2013 | $774 | $14,560 | $1,960 | $12,600 |
Source: Public Records
Map
Nearby Homes
- 949 Leland Ave
- 0 Latham
- 1120 Richie Ave
- 974 Richie Ave
- 824 Rice Ave
- 1160 Richie Ave
- 513 N Charles St
- 618 Woodward Ave
- 703 N Collett St
- 503 N Charles St
- 1209 Rice Ave
- 1015 N Cole St
- 1027 Brice Ave
- 615 N Collett St
- 1023 Brice Ave
- 631 Hazel Ave
- 1245 Latham Ave
- 508 N Collett St
- 745 Ewing Ave
- 841 N Baxter St
- 1019 Hazel Ave
- 1015 Hazel Ave
- 1013 Hazel Ave
- 1028 Leland Ave
- 1026 Leland Ave
- 1020 Hazel Ave
- 823 N Charles St
- 1012 Leland Ave
- 815 N Charles St
- 809 N Charles St
- 1016 Hazel Ave
- 1010 Leland Ave
- 1012 Hazel Ave
- 1008 Hazel Ave
- 1008 Leland Ave
- 903 N Charles St
- 1015 Delphos Ave
- 1002 Leland Ave
- 820 N Charles St
- 901 N Jameson Ave
Your Personal Tour Guide
Ask me questions while you tour the home.