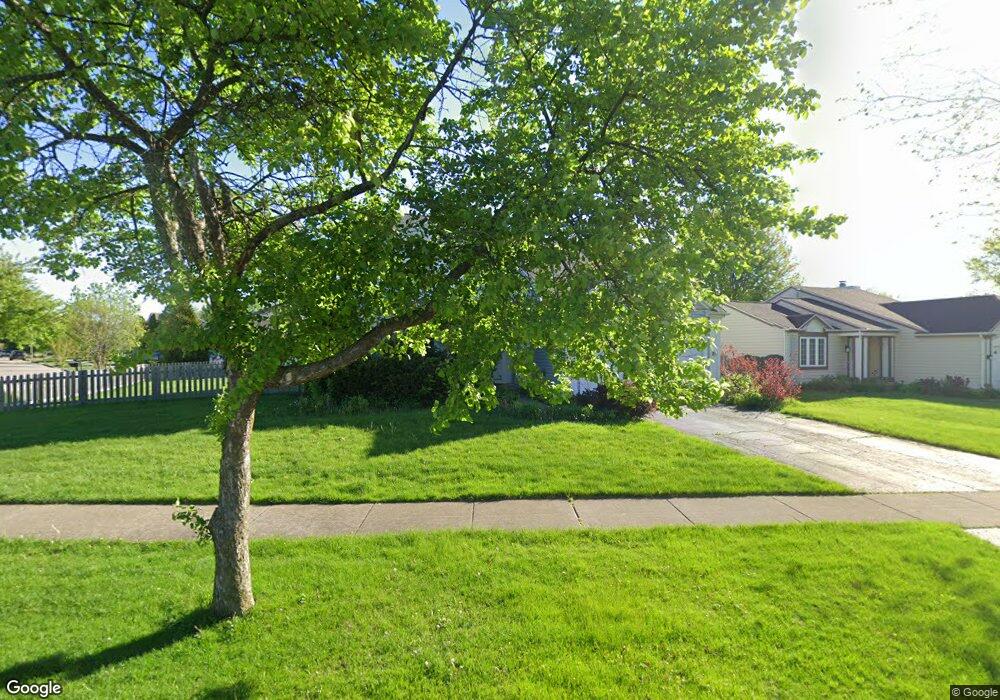
1023 Huntington Dr Aurora, IL 60506
Edgelawn Randall NeighborhoodEstimated Value: $360,000 - $382,000
4
Beds
3
Baths
1,900
Sq Ft
$196/Sq Ft
Est. Value
About This Home
This home is located at 1023 Huntington Dr, Aurora, IL 60506 and is currently estimated at $373,069, approximately $196 per square foot. 1023 Huntington Dr is a home located in Kane County with nearby schools including Smith Elementary School, Jewel Middle School, and West Aurora High School.
Ownership History
Date
Name
Owned For
Owner Type
Purchase Details
Closed on
Nov 1, 2016
Sold by
Danielson Douglas D
Bought by
Sbk Family Trust
Current Estimated Value
Purchase Details
Closed on
Dec 5, 2012
Sold by
Danielson Debra L and Danielson Douglas D
Bought by
Danielson Douglas D and Danielson Debra L
Purchase Details
Closed on
Oct 14, 1994
Sold by
Pulte Home Corp
Bought by
Danielson Douglas D and Danielson Debra L
Home Financials for this Owner
Home Financials are based on the most recent Mortgage that was taken out on this home.
Original Mortgage
$144,500
Interest Rate
8.75%
Mortgage Type
FHA
Create a Home Valuation Report for This Property
The Home Valuation Report is an in-depth analysis detailing your home's value as well as a comparison with similar homes in the area
Home Values in the Area
Average Home Value in this Area
Purchase History
| Date | Buyer | Sale Price | Title Company |
|---|---|---|---|
| Sbk Family Trust | -- | None Available | |
| Danielson Douglas D | -- | None Available | |
| Danielson Douglas D | $150,000 | Guaranty National Title |
Source: Public Records
Mortgage History
| Date | Status | Borrower | Loan Amount |
|---|---|---|---|
| Previous Owner | Danielson Douglas D | $144,500 |
Source: Public Records
Tax History Compared to Growth
Tax History
| Year | Tax Paid | Tax Assessment Tax Assessment Total Assessment is a certain percentage of the fair market value that is determined by local assessors to be the total taxable value of land and additions on the property. | Land | Improvement |
|---|---|---|---|---|
| 2024 | $7,753 | $105,915 | $18,563 | $87,352 |
| 2023 | $7,421 | $94,635 | $16,586 | $78,049 |
| 2022 | $7,052 | $85,664 | $15,133 | $70,531 |
| 2021 | $6,738 | $79,754 | $14,089 | $65,665 |
| 2020 | $6,786 | $78,484 | $13,087 | $65,397 |
| 2019 | $6,524 | $72,717 | $12,125 | $60,592 |
| 2018 | $6,414 | $70,254 | $11,215 | $59,039 |
| 2017 | $6,384 | $68,026 | $10,334 | $57,692 |
| 2016 | $6,209 | $64,450 | $8,858 | $55,592 |
| 2015 | -- | $56,046 | $7,617 | $48,429 |
| 2014 | -- | $52,179 | $7,326 | $44,853 |
| 2013 | -- | $53,135 | $7,221 | $45,914 |
Source: Public Records
Map
Nearby Homes
- 910 Southbridge Dr
- 1532 Golden Oaks Pkwy
- 1296 Yellowpine Dr
- 795 N Elmwood Dr
- 781 N Elmwood Dr
- 1035 Newcastle Ln
- 1104 New Haven Ave
- 1351 Monomoy St Unit D
- 833 N Randall Rd Unit C4
- 1389 Monomoy St Unit B2
- 972 Westgate Dr
- 461 Sullivan Rd
- 616 Morton Ave
- 967 Sapphire Ln
- 959 Sapphire Ln
- 963 Sapphire Ln
- 960 Sapphire Ln
- 964 Sapphire Ln
- 1815 Brighton Cir
- 1120 Emerald Dr
- 1021 Huntington Dr
- 1295 Golden Oaks Pkwy
- 1301 Golden Oaks Pkwy
- 1290 Golden Oaks Pkwy
- 1300 Golden Oaks Pkwy
- 1310 N Elmwood Dr Unit 2
- 1011 Huntington Dr
- 1280 Golden Oaks Pkwy
- 1320 N Elmwood Dr
- 1311 Golden Oaks Pkwy
- 1310 Golden Oaks Pkwy
- 1330 N Elmwood Dr
- 1270 Golden Oaks Pkwy
- 1321 Golden Oaks Pkwy
- 1323 Eastwood Dr
- 1010 Huntington Dr
- 1320 Golden Oaks Pkwy
- 1340 N Elmwood Dr
- 1325 Eastwood Dr
- 1321 Eastwood Dr Unit 4