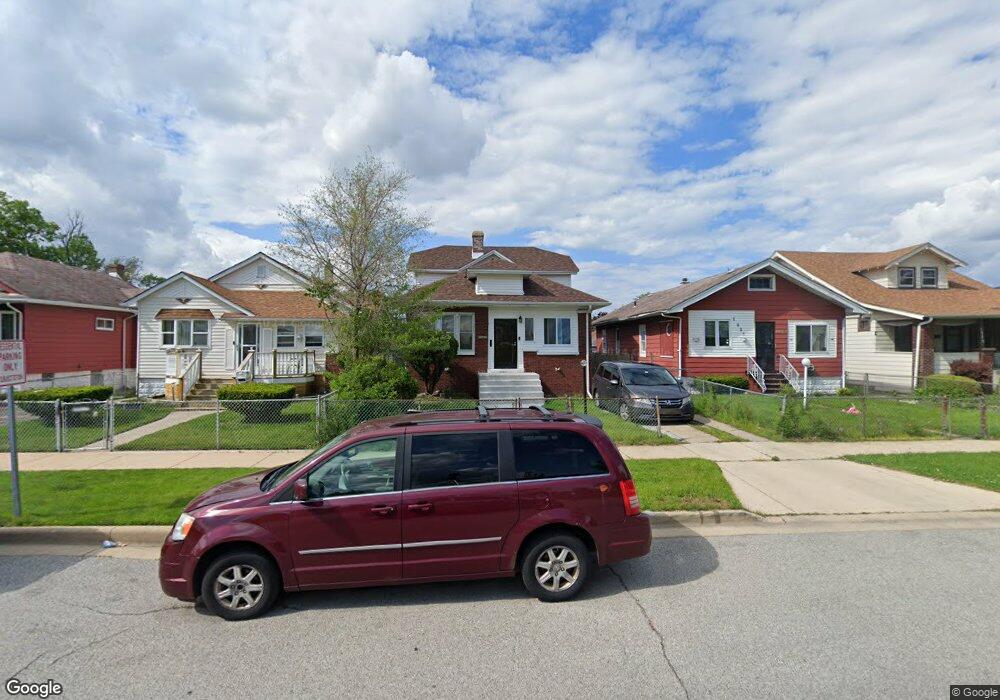
1023 Lyons St Hammond, IN 46320
Estimated Value: $157,000 - $212,005
4
Beds
2
Baths
1,086
Sq Ft
$167/Sq Ft
Est. Value
About This Home
This home is located at 1023 Lyons St, Hammond, IN 46320 and is currently estimated at $181,001, approximately $166 per square foot. 1023 Lyons St is a home located in Lake County with nearby schools including Maywood Elementary School, Eggers Middle School, and Hammond High School.
Ownership History
Date
Name
Owned For
Owner Type
Purchase Details
Closed on
Mar 8, 2019
Sold by
White Tiffany N and Yisra El Tiffany Nicole
Bought by
Yisra El Tiffany Nicole and Yisra El Domel
Current Estimated Value
Purchase Details
Closed on
Sep 22, 2009
Sold by
Alston Brian and Alston Carleta L
Bought by
White Tiffany N
Home Financials for this Owner
Home Financials are based on the most recent Mortgage that was taken out on this home.
Original Mortgage
$79,041
Outstanding Balance
$51,560
Interest Rate
5.38%
Mortgage Type
FHA
Estimated Equity
$129,441
Create a Home Valuation Report for This Property
The Home Valuation Report is an in-depth analysis detailing your home's value as well as a comparison with similar homes in the area
Home Values in the Area
Average Home Value in this Area
Purchase History
| Date | Buyer | Sale Price | Title Company |
|---|---|---|---|
| Yisra El Tiffany Nicole | -- | None Available | |
| White Tiffany N | -- | Chicago Title Insurance Co |
Source: Public Records
Mortgage History
| Date | Status | Borrower | Loan Amount |
|---|---|---|---|
| Open | White Tiffany N | $79,041 |
Source: Public Records
Tax History
| Year | Tax Paid | Tax Assessment Tax Assessment Total Assessment is a certain percentage of the fair market value that is determined by local assessors to be the total taxable value of land and additions on the property. | Land | Improvement |
|---|---|---|---|---|
| 2025 | $1,221 | $158,800 | $19,300 | $139,500 |
| 2024 | $4,488 | $142,400 | $19,300 | $123,100 |
| 2023 | $1,128 | $93,900 | $21,100 | $72,800 |
| 2022 | $1,057 | $88,700 | $21,100 | $67,600 |
| 2021 | $509 | $54,000 | $7,100 | $46,900 |
| 2020 | $378 | $44,300 | $7,100 | $37,200 |
| 2019 | $445 | $40,200 | $7,100 | $33,100 |
| 2018 | $377 | $38,600 | $7,100 | $31,500 |
| 2017 | $410 | $38,000 | $7,100 | $30,900 |
| 2016 | $693 | $66,400 | $7,100 | $59,300 |
| 2014 | $648 | $69,100 | $7,100 | $62,000 |
| 2013 | $596 | $66,100 | $7,100 | $59,000 |
Source: Public Records
Map
Nearby Homes
- 924 Highland St
- 920 Highland St
- 1137 Lyons St
- 1128 Highland St
- 5901 Columbia Ave
- 5856 Wallace Rd
- 830 Becker St
- 826 Merrill St
- 904 Field St
- 1016 Ames St
- 1360 Sherman St
- 911 Conkey St
- 909 Conkey St
- 922 Summer St
- 1119 Sibley St
- 5631 Alice St
- 1007 Moss St
- 5632 Claude Ave
- 6244 Madison Ave
- 1019 Cleveland St
Your Personal Tour Guide
Ask me questions while you tour the home.