1023 Morse St Oceanside, CA 92054
South Oceanside NeighborhoodEstimated Value: $1,235,953 - $1,526,000
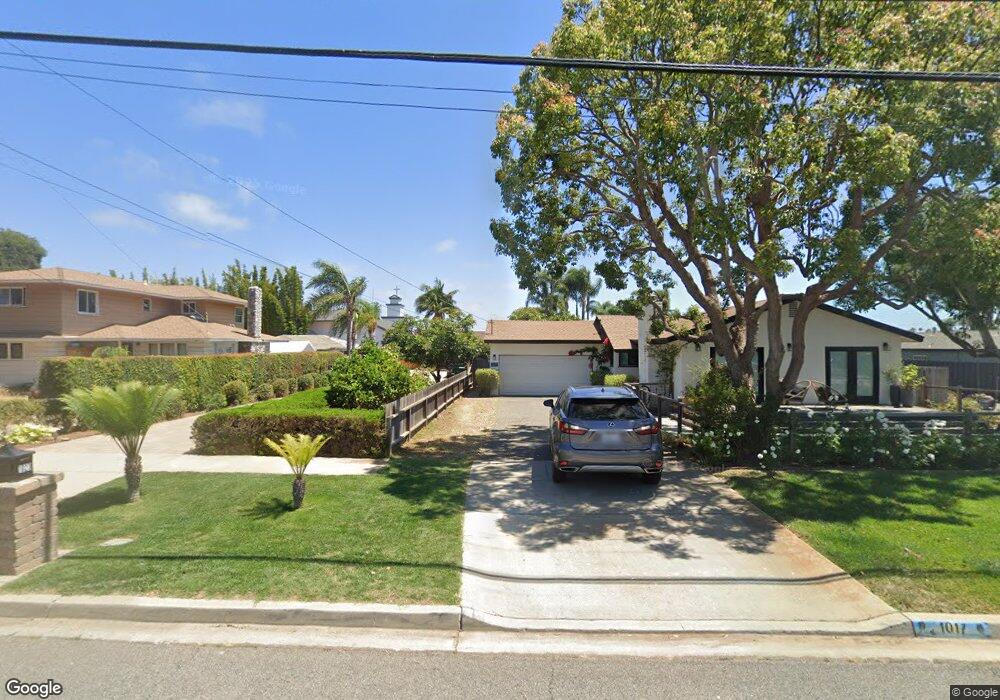
About This Home
This home is located at 1023 Morse St, Oceanside, CA 92054 and is currently estimated at $1,438,738, approximately $808 per square foot. 1023 Morse St is a home located in San Diego County with nearby schools including South Oceanside Elementary School, Lincoln Middle School, and Oceanside High School.
Ownership History
We collect this data history from publicly available records. To have your information removed, we recommend requesting removal directly through your county’s website.
Purchase Details
Purchase Details
Home Values in the Area
Average Home Value in this Area
Purchase History
We collect this data history from publicly available records. To have your information removed, we recommend requesting removal directly through your county’s website.
| Date | Buyer | Sale Price | Title Company |
|---|---|---|---|
| -- | None Available | ||
| -- | -- |
Mortgage History
We collect this data history from publicly available records. To have your information removed, we recommend requesting removal directly through your county’s website.
| Date | Status | Borrower | Loan Amount |
|---|---|---|---|
| Closed | $153,000 |
Tax History
We collect this data history from publicly available records. To have your information removed, we recommend requesting removal directly through your county’s website.
| Year | Tax Paid | Tax Assessment Tax Assessment Total Assessment is a certain percentage of the fair market value that is determined by local assessors to be the total taxable value of land and additions on the property. | Land | Improvement |
|---|---|---|---|---|
| 2025 | $1,643 | $152,348 | $42,477 | $109,871 |
| 2024 | $1,643 | $149,362 | $41,645 | $107,717 |
| 2023 | $1,591 | $146,434 | $40,829 | $105,605 |
| 2022 | $1,565 | $143,564 | $40,029 | $103,535 |
| 2021 | $1,570 | $140,750 | $39,245 | $101,505 |
| 2020 | $1,522 | $139,308 | $38,843 | $100,465 |
| 2019 | $1,477 | $136,578 | $38,082 | $98,496 |
| 2018 | $1,460 | $133,901 | $37,336 | $96,565 |
| 2017 | $70 | $131,276 | $36,604 | $94,672 |
| 2016 | $1,383 | $128,703 | $35,887 | $92,816 |
| 2015 | $1,343 | $126,770 | $35,348 | $91,422 |
| 2014 | $1,292 | $124,288 | $34,656 | $89,632 |
Map
- 1511 Stewart St
- 1204 California St
- 710 Morse St
- 1806 Stewart St
- 1558 Vista Del Mar Way Unit 3
- 1566 Vista Del Mar Way Unit 3
- 1622 S Tremont St
- 1714 California St
- 1457 Kurtz St
- 1720 California St
- 0 Clementine St Unit 5
- 1597 Kelly St
- 1602 S Pacific St Unit 100
- 912 S Tremont St
- 1640 S Pacific St Unit 8
- 1731 S Pacific St
- 215-217 S Myers St Unit 4 & 5
- 1409 S Pacific St
- 1115 Sea Glass Way
- 1390 Blue Port Way
- 1105 Morse St
- 1107 Morse St
- 1017 Morse St
- 1111 Morse St
- 1015 Morse St
- 1015 Morse St Unit A
- 1015 Morse St Unit B
- 1040 Whaley St
- 1108 Morse St
- 1110 Morse St
- 1016 Morse St
- 1601 Stewart St
- 1609 Stewart St
- 1009 Morse St
- 1112 Morse St
- 1617 Stewart St
- 1014 Morse St
- 1116 Morse St
- 1030 Whaley St
- 1006 Morse St
Ask me questions while you tour the home.