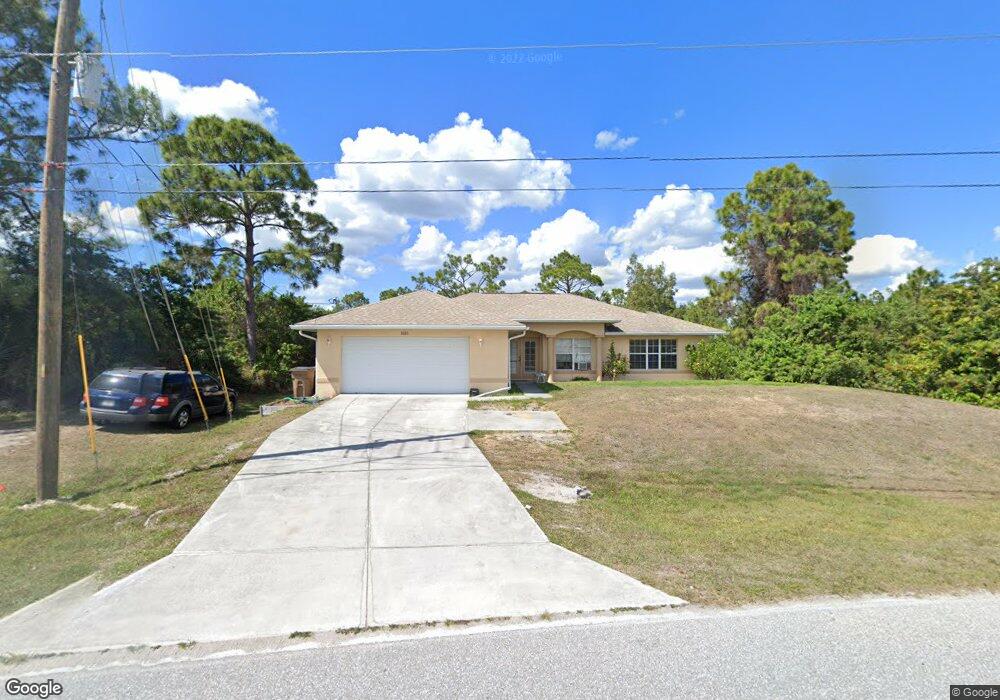
1023 N Gator Cir Cape Coral, FL 33909
Jacaranda NeighborhoodEstimated Value: $298,000 - $394,000
3
Beds
2
Baths
2,002
Sq Ft
$172/Sq Ft
Est. Value
About This Home
This home is located at 1023 N Gator Cir, Cape Coral, FL 33909 and is currently estimated at $343,728, approximately $171 per square foot. 1023 N Gator Cir is a home located in Lee County with nearby schools including Dr. Carrie D. Robinson Littleton Elementary School, Caloosa Elementary School, and Tropic Isles Elementary School.
Ownership History
Date
Name
Owned For
Owner Type
Purchase Details
Closed on
Feb 3, 2025
Sold by
Knipple William
Bought by
Brk Investing Limited Liability Company and Conroy
Current Estimated Value
Purchase Details
Closed on
Jan 19, 2013
Sold by
Knecht Bernath and Knecht Eleanore
Bought by
Conroy Peter J and Knipple William
Purchase Details
Closed on
Apr 7, 2006
Sold by
Chandler & Stephen Llc
Bought by
Knecht Bernath and Knecht Eleanor
Home Financials for this Owner
Home Financials are based on the most recent Mortgage that was taken out on this home.
Original Mortgage
$308,000
Interest Rate
8.75%
Mortgage Type
Unknown
Purchase Details
Closed on
May 20, 2005
Sold by
Nester Barbara
Bought by
Chandler & Stephan Llc
Purchase Details
Closed on
Aug 10, 2004
Sold by
Holness Victor E and Holness Elaine C
Bought by
Nester Barbara
Create a Home Valuation Report for This Property
The Home Valuation Report is an in-depth analysis detailing your home's value as well as a comparison with similar homes in the area
Home Values in the Area
Average Home Value in this Area
Purchase History
| Date | Buyer | Sale Price | Title Company |
|---|---|---|---|
| Brk Investing Limited Liability Company | $100 | None Listed On Document | |
| Conroy Peter J | $100,000 | Attorney | |
| Knecht Bernath | $92,000 | First City Title | |
| Chandler & Stephan Llc | $75,000 | Avalon Title Inc | |
| Nester Barbara | $40,000 | Island Title Guaranty Agency |
Source: Public Records
Mortgage History
| Date | Status | Borrower | Loan Amount |
|---|---|---|---|
| Previous Owner | Knecht Bernath | $308,000 |
Source: Public Records
Tax History Compared to Growth
Tax History
| Year | Tax Paid | Tax Assessment Tax Assessment Total Assessment is a certain percentage of the fair market value that is determined by local assessors to be the total taxable value of land and additions on the property. | Land | Improvement |
|---|---|---|---|---|
| 2025 | $5,203 | $266,150 | $45,139 | $221,011 |
| 2024 | $4,883 | $259,954 | -- | -- |
| 2023 | $4,883 | $236,322 | $0 | $0 |
| 2022 | $4,550 | $214,838 | $0 | $0 |
| 2021 | $4,052 | $195,307 | $7,560 | $187,747 |
| 2020 | $3,940 | $182,490 | $6,825 | $175,665 |
| 2019 | $3,807 | $176,829 | $7,875 | $168,954 |
| 2018 | $3,900 | $178,453 | $8,820 | $169,633 |
| 2017 | $3,734 | $172,811 | $11,025 | $161,786 |
| 2016 | $3,404 | $152,484 | $11,025 | $141,459 |
| 2015 | $3,150 | $134,414 | $7,140 | $127,274 |
| 2014 | $2,985 | $125,807 | $6,317 | $119,490 |
| 2013 | -- | $107,894 | $5,100 | $102,794 |
Source: Public Records
Map
Nearby Homes
- 1034 NE 40th Terrace
- 1013 NE 39th Terrace
- 4213 NE 11th Ave
- 4011 NE 12th Ave
- 3916 NE 9th Place
- 4019 NE 9th Ave
- 3912 NE 9th Place Unit 25
- 3902 NE 11th Place
- 4112 NE 9th Place
- 3923 NE 12th Ave Unit 57
- 4313 NE 11th Ave
- 2104 NE 40th Terrace
- 2102 NE 40th Terrace
- 1224 NE 41st St
- 1229 NE 41st St
- 4120 NE 9th Ave
- 4144 NE 9th Place
- 1000 NE 43rd Terrace
- 2323 NE 41st Ln
- 3916 NE 8th Place
- 4031 NW 10th Place
- 4031 NE 10th Place
- 4033 NE 10th Place
- 4025 NE 10th Place
- 4020 W Gator Cir
- 1027 N Gator Cir
- 1024 N Gator Cir
- 4045 NE 10th Place
- 1026 N Gator Cir
- 4047 NE 10th Place
- 1023 NE 40th Terrace
- 4028 NE 10th Place
- 4010 W Gator Cir
- 4012 W Gator Cir
- 4038 NE 10th Place
- 1030 N Gator Cir
- 1032 N Gator Cir
- 4013 NE 10th Place
- 4042 NE 10th Place
- 1026 NE 40th Terrace