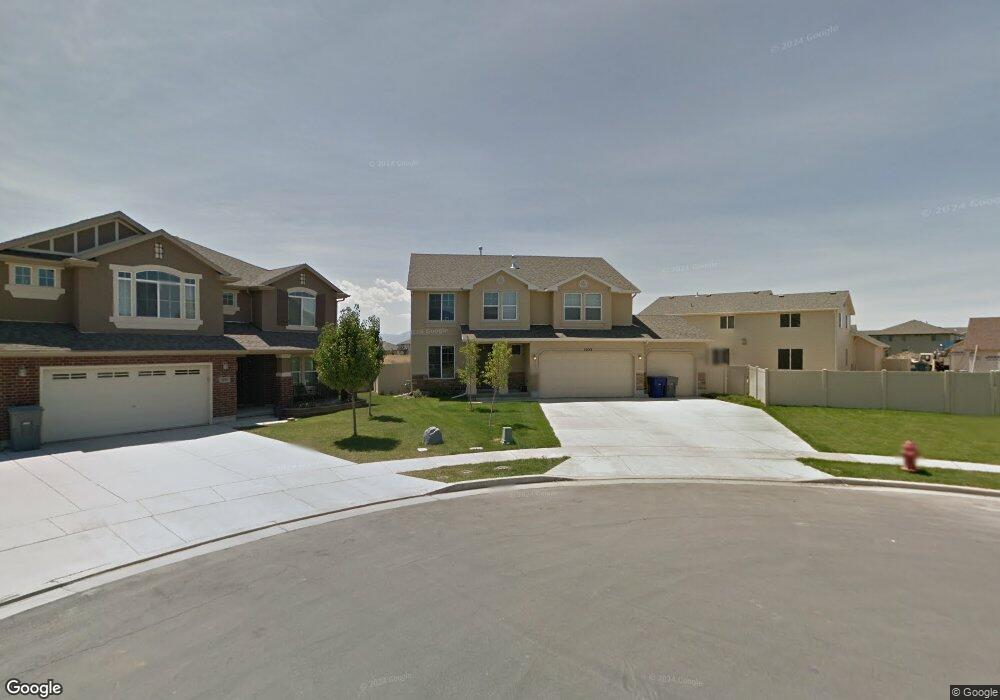
1023 Newham Ct North Salt Lake, UT 84054
Estimated Value: $613,000 - $670,000
5
Beds
3
Baths
2,434
Sq Ft
$264/Sq Ft
Est. Value
About This Home
This home is located at 1023 Newham Ct, North Salt Lake, UT 84054 and is currently estimated at $643,096, approximately $264 per square foot. 1023 Newham Ct is a home located in Davis County with nearby schools including Foxboro School, Mueller Park Junior High School, and Bountiful High School.
Ownership History
Date
Name
Owned For
Owner Type
Purchase Details
Closed on
Oct 23, 2020
Sold by
Lamarr Stephen and Lamar Nora
Bought by
Hunsaker Jared Joseph and Hunsaker Carrie Jackson
Current Estimated Value
Home Financials for this Owner
Home Financials are based on the most recent Mortgage that was taken out on this home.
Original Mortgage
$360,000
Outstanding Balance
$320,201
Interest Rate
2.9%
Mortgage Type
New Conventional
Estimated Equity
$322,895
Purchase Details
Closed on
Feb 27, 2018
Sold by
Holmes Donald
Bought by
Lamarr Stephen and Lamarr Nora
Home Financials for this Owner
Home Financials are based on the most recent Mortgage that was taken out on this home.
Original Mortgage
$341,116
Interest Rate
4.4%
Mortgage Type
FHA
Purchase Details
Closed on
May 12, 2011
Sold by
Woodside Amberly Llc
Bought by
Holmes Donald
Home Financials for this Owner
Home Financials are based on the most recent Mortgage that was taken out on this home.
Original Mortgage
$243,662
Interest Rate
4.75%
Mortgage Type
FHA
Create a Home Valuation Report for This Property
The Home Valuation Report is an in-depth analysis detailing your home's value as well as a comparison with similar homes in the area
Home Values in the Area
Average Home Value in this Area
Purchase History
| Date | Buyer | Sale Price | Title Company |
|---|---|---|---|
| Hunsaker Jared Joseph | -- | Mountain View Title | |
| Lamarr Stephen | -- | Stewart Title | |
| Holmes Donald | -- | Us Title Company Of |
Source: Public Records
Mortgage History
| Date | Status | Borrower | Loan Amount |
|---|---|---|---|
| Open | Hunsaker Jared Joseph | $360,000 | |
| Previous Owner | Lamarr Stephen | $341,116 | |
| Previous Owner | Holmes Donald | $243,662 |
Source: Public Records
Tax History Compared to Growth
Tax History
| Year | Tax Paid | Tax Assessment Tax Assessment Total Assessment is a certain percentage of the fair market value that is determined by local assessors to be the total taxable value of land and additions on the property. | Land | Improvement |
|---|---|---|---|---|
| 2025 | $3,073 | $317,900 | $117,280 | $200,620 |
| 2024 | $3,073 | $309,100 | $125,041 | $184,059 |
| 2023 | $2,898 | $527,000 | $165,649 | $361,351 |
| 2022 | $3,030 | $302,500 | $71,993 | $230,507 |
| 2021 | $2,720 | $412,000 | $106,859 | $305,141 |
| 2020 | $2,765 | $376,000 | $90,898 | $285,102 |
| 2019 | $2,651 | $367,000 | $68,443 | $298,557 |
| 2018 | $2,304 | $333,000 | $62,221 | $270,779 |
| 2016 | $2,022 | $155,430 | $34,222 | $121,208 |
| 2015 | $2,053 | $151,635 | $34,222 | $117,413 |
| 2014 | $1,996 | $150,274 | $34,222 | $116,052 |
| 2013 | -- | $119,900 | $30,878 | $89,022 |
Source: Public Records
Map
Nearby Homes
- 1052 Chidester Dr
- 997 N Fox Hollow Dr
- 997 Amberly Dr
- 967 Amberly Dr
- 1150 Wiltshire Dr
- 1147 Abbotsford Dr
- 1022 Allington Dr
- 928 Amberly Dr
- 1002 W Stonehaven Dr Unit 108
- 942 N Abbey Dr
- 1074 Allington Dr
- 940 W Stonehaven Dr
- 920 W Stonehaven Dr
- 1072 W Stonehaven Dr
- 1147 Ethnie Ct
- Somerset B Plan at Clifton Place Townhomes
- Somerset A Plan at Clifton Place Townhomes
- Camden Plan at Clifton Place Townhomes
- Charleston Plan at Clifton Place Townhomes
- Kensington Plan at Clifton Place Townhomes