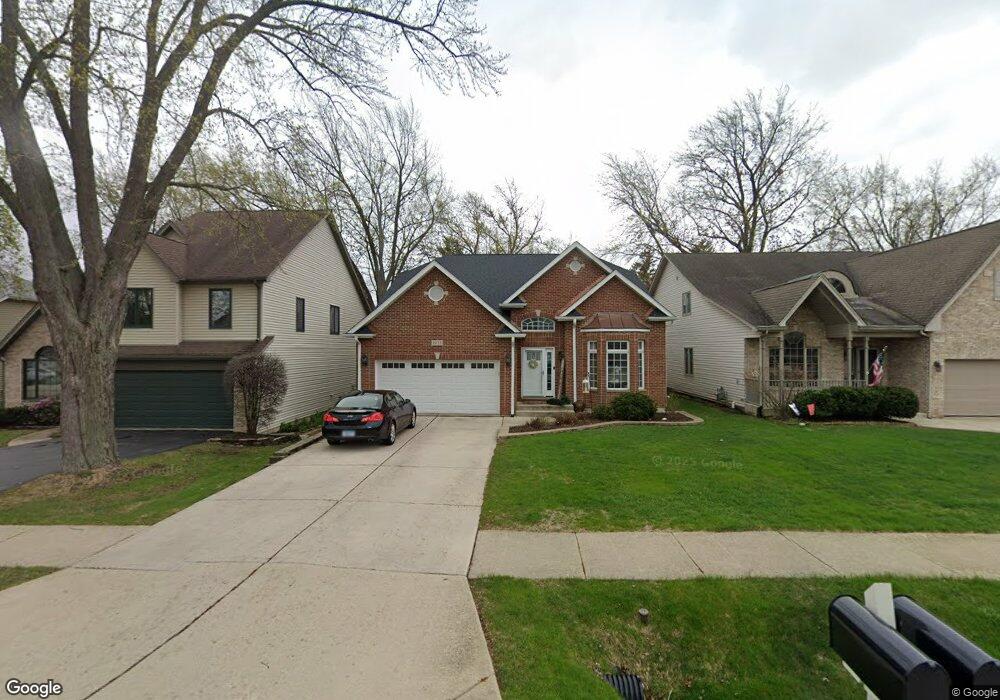
1023 Oxford St Downers Grove, IL 60516
South Downers Grove NeighborhoodEstimated Value: $757,554 - $859,000
--
Bed
1
Bath
2,751
Sq Ft
$294/Sq Ft
Est. Value
About This Home
This home is located at 1023 Oxford St, Downers Grove, IL 60516 and is currently estimated at $810,139, approximately $294 per square foot. 1023 Oxford St is a home located in DuPage County with nearby schools including Kingsley Elementary School, O'Neill Middle School, and Downers Grove South High School.
Ownership History
Date
Name
Owned For
Owner Type
Purchase Details
Closed on
Jun 27, 2003
Sold by
Porreca Builders Inc
Bought by
Johnson Timothy D and Johnson Suzann
Current Estimated Value
Home Financials for this Owner
Home Financials are based on the most recent Mortgage that was taken out on this home.
Original Mortgage
$200,000
Interest Rate
5.3%
Mortgage Type
Purchase Money Mortgage
Purchase Details
Closed on
Dec 24, 2002
Sold by
Porreca Builders Inc
Bought by
Sbragia John M and Sbragia Alicia I
Home Financials for this Owner
Home Financials are based on the most recent Mortgage that was taken out on this home.
Original Mortgage
$535,300
Interest Rate
6.13%
Mortgage Type
Construction
Purchase Details
Closed on
Sep 30, 2002
Sold by
Carter Dennis and Estate Of Anna C Carter
Bought by
Porreca Builders Inc
Create a Home Valuation Report for This Property
The Home Valuation Report is an in-depth analysis detailing your home's value as well as a comparison with similar homes in the area
Home Values in the Area
Average Home Value in this Area
Purchase History
| Date | Buyer | Sale Price | Title Company |
|---|---|---|---|
| Johnson Timothy D | $467,000 | -- | |
| Sbragia John M | $133,000 | Ctic | |
| Porreca Builders Inc | $248,000 | -- |
Source: Public Records
Mortgage History
| Date | Status | Borrower | Loan Amount |
|---|---|---|---|
| Previous Owner | Johnson Timothy D | $200,000 | |
| Previous Owner | Sbragia John M | $535,300 |
Source: Public Records
Tax History Compared to Growth
Tax History
| Year | Tax Paid | Tax Assessment Tax Assessment Total Assessment is a certain percentage of the fair market value that is determined by local assessors to be the total taxable value of land and additions on the property. | Land | Improvement |
|---|---|---|---|---|
| 2024 | $12,083 | $219,061 | $40,401 | $178,660 |
| 2023 | $11,495 | $201,380 | $37,140 | $164,240 |
| 2022 | $11,087 | $194,380 | $35,850 | $158,530 |
| 2021 | $10,378 | $192,170 | $35,440 | $156,730 |
| 2020 | $10,188 | $188,370 | $34,740 | $153,630 |
| 2019 | $9,869 | $180,740 | $33,330 | $147,410 |
| 2018 | $9,511 | $172,410 | $33,170 | $139,240 |
| 2017 | $9,213 | $165,910 | $31,920 | $133,990 |
| 2016 | $9,035 | $158,340 | $30,460 | $127,880 |
| 2015 | $8,942 | $148,970 | $28,660 | $120,310 |
| 2014 | $8,950 | $144,850 | $27,870 | $116,980 |
| 2013 | $8,769 | $144,170 | $27,740 | $116,430 |
Source: Public Records
Map
Nearby Homes
- 1029 Oxford St
- 6610 Main St
- 1003 Oxford St
- 6545 Main St Unit 408
- 6565 Main St Unit 401
- 6565 Main St Unit 204
- 1135 Carol St
- 1108 Carol St
- 6325 Barrett St
- 6541 Lyman Ave
- 6651 Dunham Rd
- 913 62nd St
- 6820 Barrett St
- 1032 61st St
- 824 62nd St
- 6901 Meadowcrest Dr
- 6111 Dunham Rd
- 1527 62nd St
- 419 63rd St
- 1036 Claremont Dr