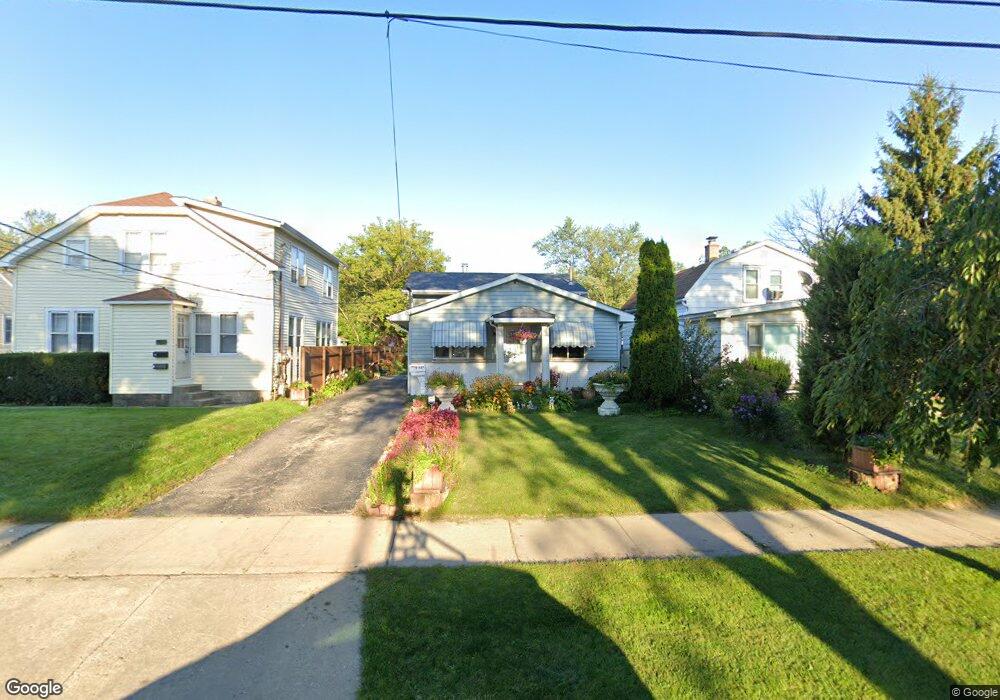
1023 Pine St Waukegan, IL 60085
Waukegan Gardens NeighborhoodEstimated Value: $224,000 - $261,351
4
Beds
2
Baths
1,152
Sq Ft
$216/Sq Ft
Est. Value
About This Home
This home is located at 1023 Pine St, Waukegan, IL 60085 and is currently estimated at $248,838, approximately $216 per square foot. 1023 Pine St is a home located in Lake County with nearby schools including Glen Flora Elementary School, Edith M Smith Middle School, and Waukegan High School.
Ownership History
Date
Name
Owned For
Owner Type
Purchase Details
Closed on
Apr 28, 2005
Sold by
Guerra Jose G
Bought by
Guerra Rosa E
Current Estimated Value
Home Financials for this Owner
Home Financials are based on the most recent Mortgage that was taken out on this home.
Original Mortgage
$160,000
Outstanding Balance
$94,128
Interest Rate
7.9%
Mortgage Type
Unknown
Estimated Equity
$154,710
Purchase Details
Closed on
Jan 2, 2003
Sold by
Hud
Bought by
Guerra Jose G and Zelaya Rosa E
Home Financials for this Owner
Home Financials are based on the most recent Mortgage that was taken out on this home.
Original Mortgage
$138,000
Interest Rate
5.94%
Purchase Details
Closed on
May 30, 2000
Sold by
Ohm Dirk
Bought by
Benitez Maria E and Perez Martha Candia
Home Financials for this Owner
Home Financials are based on the most recent Mortgage that was taken out on this home.
Original Mortgage
$128,937
Interest Rate
8.56%
Mortgage Type
FHA
Create a Home Valuation Report for This Property
The Home Valuation Report is an in-depth analysis detailing your home's value as well as a comparison with similar homes in the area
Home Values in the Area
Average Home Value in this Area
Purchase History
| Date | Buyer | Sale Price | Title Company |
|---|---|---|---|
| Guerra Rosa E | -- | Stewart Title Company | |
| Guerra Jose G | -- | Ticor Title Insurance Compan | |
| Benitez Maria E | $130,000 | -- |
Source: Public Records
Mortgage History
| Date | Status | Borrower | Loan Amount |
|---|---|---|---|
| Open | Guerra Rosa E | $160,000 | |
| Previous Owner | Guerra Jose G | $138,000 | |
| Previous Owner | Benitez Maria E | $128,937 |
Source: Public Records
Tax History Compared to Growth
Tax History
| Year | Tax Paid | Tax Assessment Tax Assessment Total Assessment is a certain percentage of the fair market value that is determined by local assessors to be the total taxable value of land and additions on the property. | Land | Improvement |
|---|---|---|---|---|
| 2024 | $5,584 | $74,340 | $8,922 | $65,418 |
| 2023 | $5,509 | $67,215 | $8,068 | $59,147 |
| 2022 | $5,509 | $62,351 | $6,288 | $56,063 |
| 2021 | $4,861 | $52,622 | $5,499 | $47,123 |
| 2020 | $4,877 | $49,024 | $5,123 | $43,901 |
| 2019 | $4,856 | $44,922 | $4,694 | $40,228 |
| 2018 | $3,772 | $35,553 | $5,906 | $29,647 |
| 2017 | $3,621 | $31,454 | $5,225 | $26,229 |
| 2016 | $3,296 | $27,332 | $4,540 | $22,792 |
| 2015 | $3,119 | $24,462 | $4,063 | $20,399 |
| 2014 | $2,990 | $23,208 | $3,085 | $20,123 |
| 2012 | $3,925 | $25,144 | $3,342 | $21,802 |
Source: Public Records
Map
Nearby Homes
- 1000 Pine St
- 1105 Woodlawn Cir
- 917 N Linden Ave
- 1109 Massena Ave
- 824 N Butrick St
- 1312 N Linden Ave
- 1504 W Glen Flora Ave
- 1117 Judge Ave
- 1038 Indiana Ave
- 918 N Ash St
- 1110 N Ash St
- 1023 N Elmwood Ave
- 619 N Butrick St
- 1335 Chestnut St
- 1005 N Lewis Ave
- 1336 N Ash St
- 702 Franklin St
- 1018 W Atlantic Ave
- 522 N Poplar St
- 12787 W Grove Ave