Estimated Value: $257,000 - $278,000
3
Beds
2
Baths
1,892
Sq Ft
$142/Sq Ft
Est. Value
About This Home
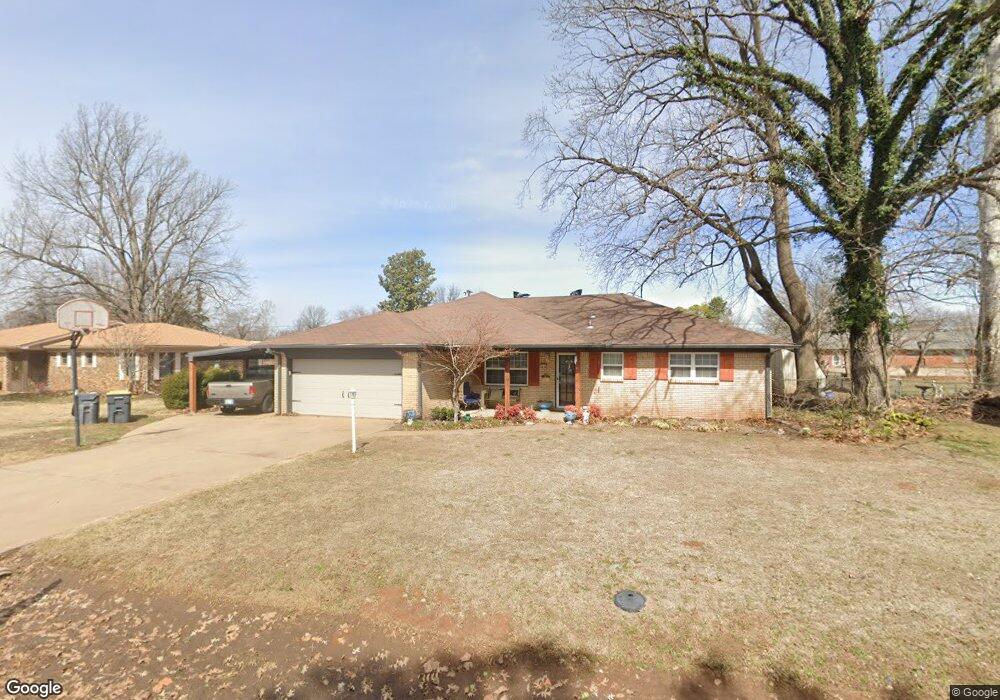
This home is located at 1023 W E St, Jenks, OK 74037 and is currently estimated at $268,622, approximately $141 per square foot. 1023 W E St is a home located in Tulsa County with nearby schools including Jenks West Elementary School, Jenks West Intermediate Elementary School, and Jenks Middle School.
Ownership History
Date
Name
Owned For
Owner Type
Purchase Details
Closed on
Dec 6, 2010
Sold by
Federal Home Loan Mortgage Corporation
Bought by
Johnson Travis R and Johnson Ashley
Current Estimated Value
Home Financials for this Owner
Home Financials are based on the most recent Mortgage that was taken out on this home.
Original Mortgage
$97,190
Outstanding Balance
$63,457
Interest Rate
4.22%
Mortgage Type
FHA
Estimated Equity
$205,165
Purchase Details
Closed on
May 27, 2010
Sold by
Coggins Scott L
Bought by
Federal Home Loan Mortgage Corporation
Purchase Details
Closed on
Jul 25, 2007
Sold by
Sharp John Carl and Sharp Janice Louise
Bought by
Coggins Scott L and Coggins Lori A
Home Financials for this Owner
Home Financials are based on the most recent Mortgage that was taken out on this home.
Original Mortgage
$144,500
Interest Rate
6.71%
Mortgage Type
Purchase Money Mortgage
Purchase Details
Closed on
May 1, 1991
Create a Home Valuation Report for This Property
The Home Valuation Report is an in-depth analysis detailing your home's value as well as a comparison with similar homes in the area
Home Values in the Area
Average Home Value in this Area
Purchase History
| Date | Buyer | Sale Price | Title Company |
|---|---|---|---|
| Johnson Travis R | $98,500 | The Oklahoma City Abstract & | |
| Federal Home Loan Mortgage Corporation | -- | None Available | |
| Coggins Scott L | $144,500 | Frisco Title Corporation | |
| -- | $69,500 | -- |
Source: Public Records
Mortgage History
| Date | Status | Borrower | Loan Amount |
|---|---|---|---|
| Open | Johnson Travis R | $97,190 | |
| Previous Owner | Coggins Scott L | $144,500 |
Source: Public Records
Tax History
| Year | Tax Paid | Tax Assessment Tax Assessment Total Assessment is a certain percentage of the fair market value that is determined by local assessors to be the total taxable value of land and additions on the property. | Land | Improvement |
|---|---|---|---|---|
| 2025 | $2,529 | $20,159 | $2,023 | $18,136 |
| 2024 | $2,328 | $19,199 | $2,003 | $17,196 |
| 2023 | $2,328 | $18,285 | $1,862 | $16,423 |
| 2022 | $2,239 | $17,414 | $2,648 | $14,766 |
| 2021 | $2,160 | $16,585 | $2,522 | $14,063 |
| 2020 | $2,070 | $16,257 | $2,472 | $13,785 |
| 2019 | $1,985 | $15,482 | $2,354 | $13,128 |
| 2018 | $1,999 | $15,482 | $2,354 | $13,128 |
| 2017 | $1,906 | $15,015 | $2,283 | $12,732 |
| 2016 | $1,860 | $14,300 | $2,255 | $12,045 |
| 2015 | $1,896 | $14,300 | $2,255 | $12,045 |
| 2014 | $1,939 | $14,300 | $2,255 | $12,045 |
Source: Public Records
Map
Nearby Homes
- 422 N Forest St
- 1012 N Forest Place
- 549 N Elm St Unit H
- 649 W 101st Place S
- 2102 W J St
- 149 W L St
- 505 N Vine St
- 1010 N 3rd St
- 9726 S Houston Ave
- 420 E F St
- 502 E D St
- 505 E B St
- 504 E B St Unit G
- 525 N Willow Place
- 13000 S 15th
- 13099 S Harvard
- 9606 S Maybelle Ave
- 10528 S Koa St
- 0 Aquarium Dr
- 412 E Duncan St