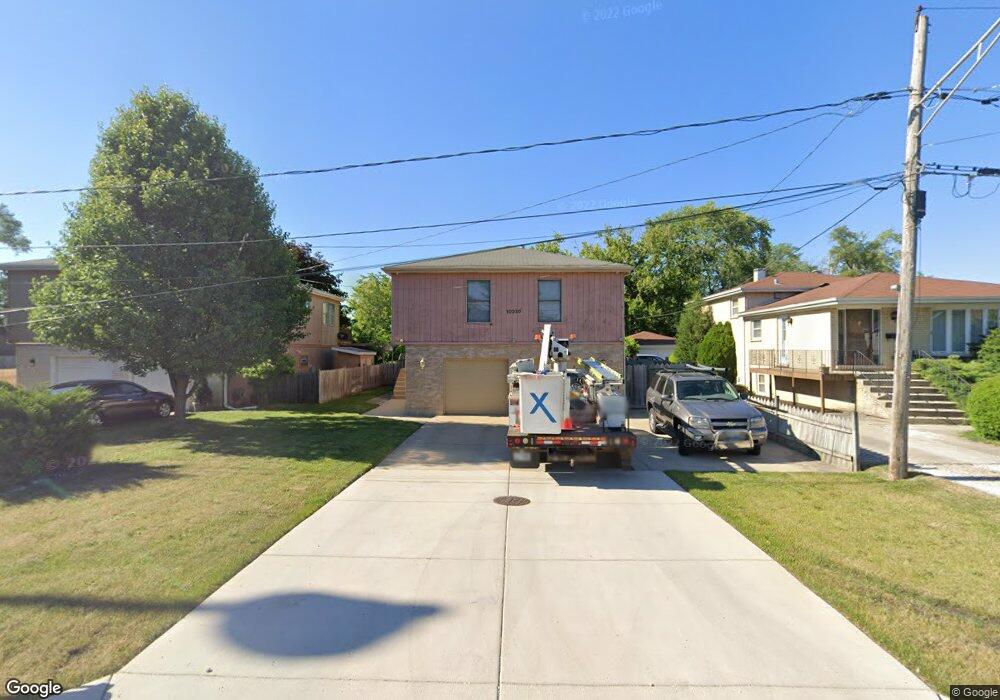
10230 W Palmer Ave Melrose Park, IL 60164
Estimated Value: $336,482 - $384,000
3
Beds
2
Baths
1,756
Sq Ft
$203/Sq Ft
Est. Value
About This Home
This home is located at 10230 W Palmer Ave, Melrose Park, IL 60164 and is currently estimated at $357,121, approximately $203 per square foot. 10230 W Palmer Ave is a home located in Cook County with nearby schools including Scott Elementary School, Mannheim Middle School, and West Leyden High School.
Ownership History
Date
Name
Owned For
Owner Type
Purchase Details
Closed on
Mar 27, 2011
Sold by
Degeorge Deborah A and Reed Deborah A
Bought by
Reed James E
Current Estimated Value
Purchase Details
Closed on
Jan 31, 2002
Sold by
Reed James E and Reed Deborah A
Bought by
Reed James E
Home Financials for this Owner
Home Financials are based on the most recent Mortgage that was taken out on this home.
Original Mortgage
$114,000
Interest Rate
7.24%
Purchase Details
Closed on
Jul 29, 1995
Sold by
Kulaga Anrezej M and Kulaga Ewa M
Bought by
Reed James E and Reed Deborah A
Home Financials for this Owner
Home Financials are based on the most recent Mortgage that was taken out on this home.
Original Mortgage
$108,000
Interest Rate
7.51%
Purchase Details
Closed on
Dec 21, 1993
Sold by
Cunningham Robert J
Bought by
Kulaga Andrzej and Kulaga Ewa
Home Financials for this Owner
Home Financials are based on the most recent Mortgage that was taken out on this home.
Original Mortgage
$65,000
Interest Rate
7.25%
Create a Home Valuation Report for This Property
The Home Valuation Report is an in-depth analysis detailing your home's value as well as a comparison with similar homes in the area
Home Values in the Area
Average Home Value in this Area
Purchase History
| Date | Buyer | Sale Price | Title Company |
|---|---|---|---|
| Reed James E | -- | None Available | |
| Reed James E | -- | Dukane Title Insurance Co | |
| Reed James E | $148,000 | -- | |
| Kulaga Andrzej | $47,333 | -- |
Source: Public Records
Mortgage History
| Date | Status | Borrower | Loan Amount |
|---|---|---|---|
| Closed | Reed James E | $114,000 | |
| Closed | Reed James E | $108,000 | |
| Previous Owner | Kulaga Andrzej | $65,000 |
Source: Public Records
Tax History Compared to Growth
Tax History
| Year | Tax Paid | Tax Assessment Tax Assessment Total Assessment is a certain percentage of the fair market value that is determined by local assessors to be the total taxable value of land and additions on the property. | Land | Improvement |
|---|---|---|---|---|
| 2024 | $7,399 | $27,533 | $2,475 | $25,058 |
| 2023 | $7,261 | $27,533 | $2,475 | $25,058 |
| 2022 | $7,261 | $27,533 | $2,475 | $25,058 |
| 2021 | $4,592 | $16,189 | $1,925 | $14,264 |
| 2020 | $4,600 | $16,189 | $1,925 | $14,264 |
| 2019 | $4,813 | $18,273 | $1,925 | $16,348 |
| 2018 | $5,934 | $19,912 | $1,650 | $18,262 |
| 2017 | $5,919 | $19,912 | $1,650 | $18,262 |
| 2016 | $5,868 | $19,912 | $1,650 | $18,262 |
| 2015 | $6,206 | $19,988 | $1,512 | $18,476 |
| 2014 | $6,123 | $19,988 | $1,512 | $18,476 |
| 2013 | $5,822 | $19,988 | $1,512 | $18,476 |
Source: Public Records
Map
Nearby Homes
- 10213 W Lyndale Ave
- 10302 W Palmer Ave
- 2118 Fairfield Ave
- 10417 W Palmer Ave
- 10115 Belden Ave
- 10445 W Palmer Ave
- 2520 Dora St
- 10510 W Fullerton Ave
- 10131 Nevada Ave
- 3201 Armitage Ave
- 9907 W Fullerton Ave
- 330 Major Dr
- 2003 Emerson Ave
- 2038 Ruby St
- 3723 N Ruby St Unit 206N
- 10501 Schubert Ave
- 2632 Westbrook Dr
- 250 Village Dr
- 10459 Diversey Ave
- 248 E Lyndale Ave
- 10232 W Palmer Ave
- 10226 W Palmer Ave
- 10224 W Palmer Ave
- 10225 W Lyndale Ave
- 10222 W Palmer Ave
- 10235 W Palmer Ave
- 10301 W Lyndale Ave
- 2133 Fairfield Ave
- 10304 W Palmer Ave
- 10219 W Lyndale Ave
- 10231 W Palmer Ave
- 10231 W Lyndale Ave
- 10305 W Lyndale Ave
- 2126 Fairfield Ave
- 10210 W Palmer Ave
- 2129 Fairfield Ave
- 10309 W Lyndale Ave
- 10308 W Palmer Ave
- 2122 Fairfield Ave