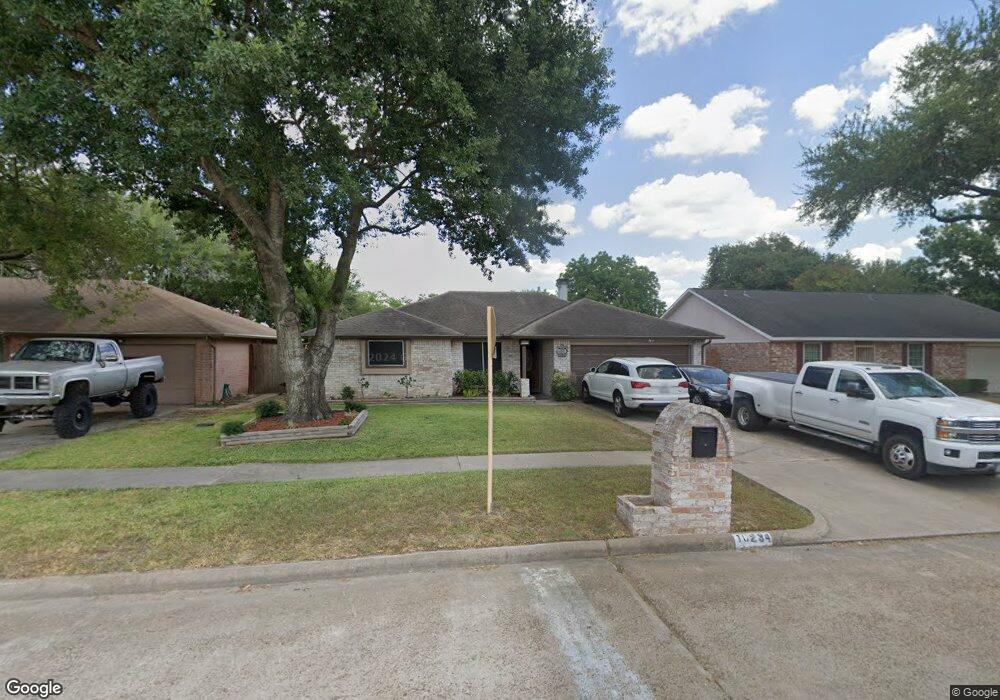
10234 Coralstone Rd Houston, TX 77086
North Houston NeighborhoodEstimated Value: $211,000 - $233,000
3
Beds
2
Baths
1,340
Sq Ft
$163/Sq Ft
Est. Value
About This Home
This home is located at 10234 Coralstone Rd, Houston, TX 77086 and is currently estimated at $218,200, approximately $162 per square foot. 10234 Coralstone Rd is a home located in Harris County with nearby schools including Kujawa EC/Pre-K/K School, Carmichael Elementary School, and Shotwell Middle School.
Ownership History
Date
Name
Owned For
Owner Type
Purchase Details
Closed on
Aug 30, 2004
Sold by
Matthews Mark
Bought by
Benford Matthews Renee
Current Estimated Value
Purchase Details
Closed on
Apr 11, 1996
Sold by
Garmany Mike and Garmany Janet
Bought by
Matthews Mark Anthony and Matthews Renee
Home Financials for this Owner
Home Financials are based on the most recent Mortgage that was taken out on this home.
Original Mortgage
$55,000
Outstanding Balance
$2,596
Interest Rate
7.38%
Estimated Equity
$215,604
Purchase Details
Closed on
Mar 14, 1996
Sold by
Ryan Michael Harry and Ryan Suzanne Keith
Bought by
Garmany Michael and Garmany Janet
Home Financials for this Owner
Home Financials are based on the most recent Mortgage that was taken out on this home.
Original Mortgage
$55,000
Outstanding Balance
$2,596
Interest Rate
7.38%
Estimated Equity
$215,604
Create a Home Valuation Report for This Property
The Home Valuation Report is an in-depth analysis detailing your home's value as well as a comparison with similar homes in the area
Home Values in the Area
Average Home Value in this Area
Purchase History
| Date | Buyer | Sale Price | Title Company |
|---|---|---|---|
| Benford Matthews Renee | -- | None Available | |
| Matthews Mark Anthony | -- | First American Title | |
| Garmany Michael | -- | First American Title |
Source: Public Records
Mortgage History
| Date | Status | Borrower | Loan Amount |
|---|---|---|---|
| Open | Matthews Mark Anthony | $55,000 | |
| Closed | Benford Matthews Renee | $0 |
Source: Public Records
Tax History Compared to Growth
Tax History
| Year | Tax Paid | Tax Assessment Tax Assessment Total Assessment is a certain percentage of the fair market value that is determined by local assessors to be the total taxable value of land and additions on the property. | Land | Improvement |
|---|---|---|---|---|
| 2025 | $2,126 | $201,987 | $38,940 | $163,047 |
| 2024 | $2,126 | $205,009 | $38,940 | $166,069 |
| 2023 | $2,126 | $211,764 | $38,940 | $172,824 |
| 2022 | $3,724 | $176,717 | $33,000 | $143,717 |
| 2021 | $3,377 | $148,839 | $33,000 | $115,839 |
| 2020 | $3,413 | $141,499 | $33,000 | $108,499 |
| 2019 | $3,226 | $133,821 | $16,655 | $117,166 |
| 2018 | $1,141 | $127,210 | $16,655 | $110,555 |
| 2017 | $2,571 | $119,587 | $14,956 | $104,631 |
| 2016 | $2,337 | $109,093 | $14,956 | $94,137 |
| 2015 | $1,645 | $101,917 | $14,956 | $86,961 |
| 2014 | $1,645 | $78,625 | $14,956 | $63,669 |
Source: Public Records
Map
Nearby Homes
- 10306 Jillana Kaye Dr
- 6822 Dusty Dawn Dr
- 6703 Deer Ridge Ln
- 6606 Dusty Dawn Dr
- 6911 Silver Star Dr
- 10214 Trade Winds Dr
- 6830 Desert Rose Ln
- 6502 Trail Valley Way
- 6615 Winding Trace Dr
- 6722 Winding Trace Dr
- 10522 Northview Dr
- 6706 Redding Springs Ln
- 7002 Sandswept Ln
- 6654 Brownie Campbell Rd
- 7023 Sandswept Ln
- 6630 Brownie Campbell Rd
- 9815 Lonsford Dr
- 10307 Bammel North Houston Rd
- 7011 Lower Arrow Dr
- 6610 Northleaf Dr
- 10302 Coralstone Rd
- 10230 Coralstone Rd
- 10327 Misty River Dr
- 10306 Coralstone Rd
- 10331 Misty River Dr
- 6803 Silver Star Dr
- 6734 Cloud Swept Ln
- 6730 Cloud Swept Ln
- 10310 Coralstone Rd
- 10323 Misty River Dr
- 10335 Misty River Dr
- 6726 Cloud Swept Ln
- 6802 Cloud Swept Ln
- 6807 Silver Star Dr
- 10339 Misty River Dr
- 10314 Coralstone Rd
- 6722 Cloud Swept Ln
- 10319 Misty River Dr
- 6806 Cloud Swept Ln
- 6811 Silver Star Dr