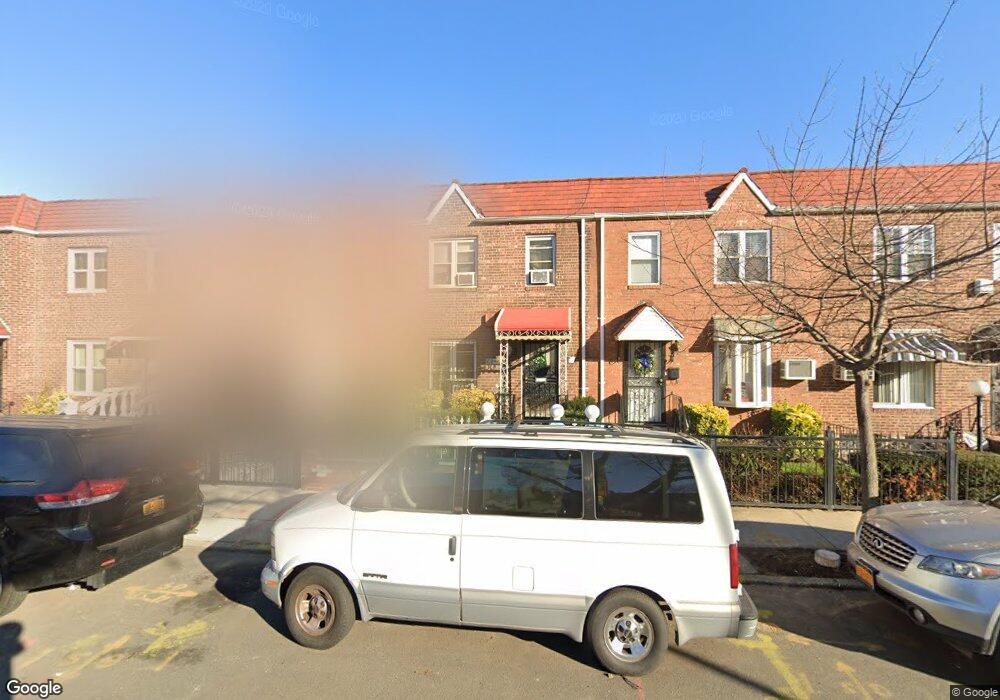
10235 183rd Place Hollis, NY 11423
Hollis NeighborhoodEstimated Value: $510,000 - $649,000
--
Bed
--
Bath
1,224
Sq Ft
$453/Sq Ft
Est. Value
About This Home
This home is located at 10235 183rd Place, Hollis, NY 11423 and is currently estimated at $554,292, approximately $452 per square foot. 10235 183rd Place is a home located in Queens County with nearby schools including P.S. 118 Lorraine Hansberry, I.S. 192 The Linden, and Wellspring Elementary & Middle.
Ownership History
Date
Name
Owned For
Owner Type
Purchase Details
Closed on
Jun 30, 2009
Sold by
Mightly May E and Mightly Rupert
Bought by
Mightly Rupert
Current Estimated Value
Purchase Details
Closed on
Apr 8, 2005
Sold by
Mightly May E and Mightly Rupert
Bought by
Aston Kitson and Mightly Rupert
Purchase Details
Closed on
Oct 27, 1998
Sold by
Ramotar Chandra and Itwaru Mohendra
Bought by
Mightly Rupert and Mightly May Elsada
Home Financials for this Owner
Home Financials are based on the most recent Mortgage that was taken out on this home.
Original Mortgage
$135,520
Interest Rate
6.85%
Purchase Details
Closed on
Oct 18, 1994
Sold by
Levy Gary and Levy Claire
Bought by
First Home Brokerage Corp and Daroma Capital Corp
Create a Home Valuation Report for This Property
The Home Valuation Report is an in-depth analysis detailing your home's value as well as a comparison with similar homes in the area
Home Values in the Area
Average Home Value in this Area
Purchase History
| Date | Buyer | Sale Price | Title Company |
|---|---|---|---|
| Mightly Rupert | -- | -- | |
| Mightly Rupert | -- | -- | |
| Aston Kitson | -- | -- | |
| Aston Kitson | -- | -- | |
| Mightly Rupert | $140,000 | Stewart Title Insurance Co | |
| Mightly Rupert | $140,000 | Stewart Title Insurance Co | |
| First Home Brokerage Corp | $85,000 | -- | |
| First Home Brokerage Corp | $85,000 | -- |
Source: Public Records
Mortgage History
| Date | Status | Borrower | Loan Amount |
|---|---|---|---|
| Previous Owner | Mightly Rupert | $135,520 | |
| Closed | Aston Kitson | $0 |
Source: Public Records
Tax History Compared to Growth
Tax History
| Year | Tax Paid | Tax Assessment Tax Assessment Total Assessment is a certain percentage of the fair market value that is determined by local assessors to be the total taxable value of land and additions on the property. | Land | Improvement |
|---|---|---|---|---|
| 2025 | $1,436 | $23,208 | $6,831 | $16,377 |
| 2024 | $1,540 | $21,896 | $6,833 | $15,063 |
| 2023 | $1,316 | $20,701 | $6,167 | $14,534 |
| 2022 | $1,407 | $30,120 | $10,260 | $19,860 |
| 2021 | $1,498 | $29,100 | $10,260 | $18,840 |
| 2020 | $1,388 | $25,140 | $10,260 | $14,880 |
| 2019 | $1,249 | $26,340 | $10,260 | $16,080 |
| 2018 | $1,099 | $17,251 | $7,302 | $9,949 |
| 2017 | $1,112 | $17,251 | $8,526 | $8,725 |
| 2016 | $1,086 | $17,251 | $8,526 | $8,725 |
| 2015 | $543 | $16,117 | $10,007 | $6,110 |
| 2014 | $543 | $15,206 | $9,172 | $6,034 |
Source: Public Records
Map
Nearby Homes
- 102-13 183rd Place
- 184-15 Henderson Ave
- 185-05 Henderson Ave
- 102-35 187th St
- 10211 187th St
- 183-67 Dunlop Ave
- 184-09 Jamaica Ave
- 104-11 188th St
- 181-18 93rd Ave
- 10220 189th St
- 183-09 Dunlop Ave
- 90-45 186th St
- 91-28 182nd Place
- 90-31 185th St
- 177-53 105th Ave
- 187-23 Brinkerhoff Ave
- 188-14 Woodhull Ave
- 90-21 185th St
- 90-19 185th St
- 91-19 182nd St
- 10233 183rd Place
- 10237 183rd Place
- 10231 183rd Place
- 10239 183rd Place
- 10241 183rd Place
- 10229 183rd Place
- 10243 183rd Place
- 10243 183rd Place
- 10227 183rd Place
- 10245 183rd Place
- 10245 183rd Place
- 10225 183 Place
- 10225 183rd Place
- 10247 183rd Place
- 10225 183rd Place
- 10223 183rd Place
- 10249 183rd Place
- 10221 183rd Place
- 10251 183rd Place
- 10238 183rd Place