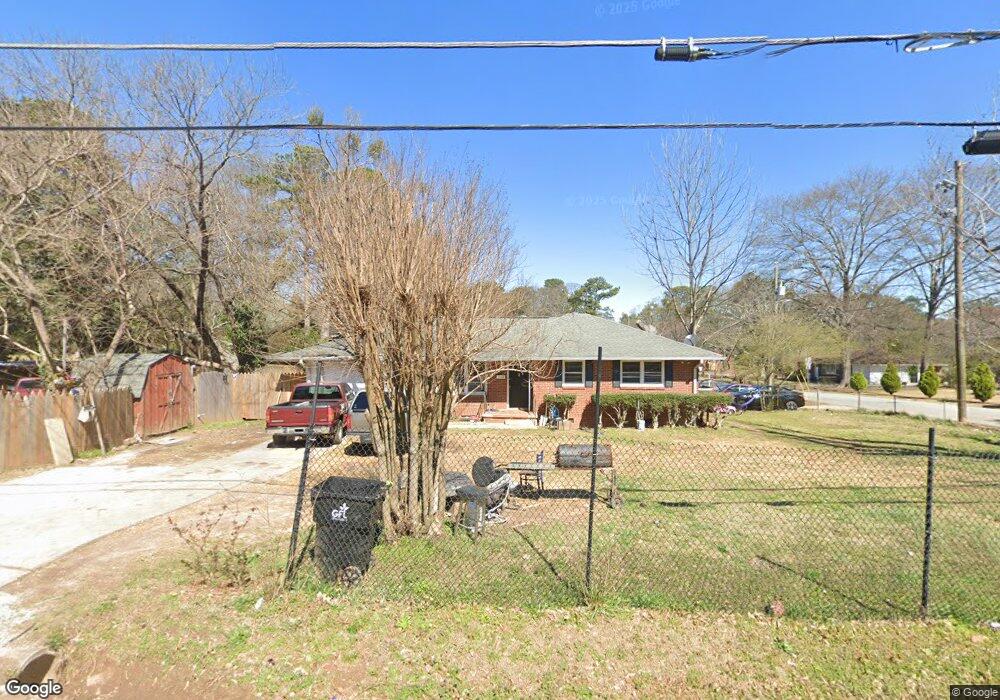
1024 Conley Rd Forest Park, GA 30297
Estimated Value: $123,000 - $176,463
3
Beds
1
Bath
967
Sq Ft
$158/Sq Ft
Est. Value
About This Home
This home is located at 1024 Conley Rd, Forest Park, GA 30297 and is currently estimated at $152,616, approximately $157 per square foot. 1024 Conley Rd is a home located in Clayton County with nearby schools including Huie Elementary School, Forest Park Middle School, and Forest Park High School.
Ownership History
Date
Name
Owned For
Owner Type
Purchase Details
Closed on
Apr 13, 2011
Sold by
Pham Hong T D
Bought by
Aat Investment Llc
Current Estimated Value
Purchase Details
Closed on
Oct 14, 2010
Sold by
Pham Hong
Bought by
Pham Hong T D
Purchase Details
Closed on
Mar 9, 2010
Sold by
Federal Home Loan Mortgage Corporation
Bought by
Pham Hong
Purchase Details
Closed on
Dec 1, 2009
Sold by
Ocwen Ln Servicing Llc
Bought by
Federal Home Loan Mortgage Corporation
Purchase Details
Closed on
Feb 5, 2003
Sold by
Doyle Ronald K
Bought by
Young Steve and Young Frances
Home Financials for this Owner
Home Financials are based on the most recent Mortgage that was taken out on this home.
Original Mortgage
$75,150
Interest Rate
5.93%
Mortgage Type
New Conventional
Purchase Details
Closed on
Apr 20, 1993
Sold by
Knight Elizabeth R and Robinson Linda G
Bought by
Doyle Ron K
Create a Home Valuation Report for This Property
The Home Valuation Report is an in-depth analysis detailing your home's value as well as a comparison with similar homes in the area
Home Values in the Area
Average Home Value in this Area
Purchase History
| Date | Buyer | Sale Price | Title Company |
|---|---|---|---|
| Aat Investment Llc | -- | -- | |
| Pham Hong T D | -- | -- | |
| Pham Hong | -- | -- | |
| Federal Home Loan Mortgage Corporation | -- | -- | |
| Ocwen Ln Servicing Llc | $26,000 | -- | |
| Young Steve | $83,500 | -- | |
| Doyle Ron K | $42,000 | -- |
Source: Public Records
Mortgage History
| Date | Status | Borrower | Loan Amount |
|---|---|---|---|
| Previous Owner | Young Steve | $75,150 | |
| Closed | Doyle Ron K | -- |
Source: Public Records
Tax History
| Year | Tax Paid | Tax Assessment Tax Assessment Total Assessment is a certain percentage of the fair market value that is determined by local assessors to be the total taxable value of land and additions on the property. | Land | Improvement |
|---|---|---|---|---|
| 2025 | $2,077 | $57,520 | $6,400 | $51,120 |
| 2024 | $2,044 | $52,400 | $6,400 | $46,000 |
| 2023 | $1,698 | $47,040 | $6,400 | $40,640 |
| 2022 | $0 | $37,760 | $6,400 | $31,360 |
| 2021 | $1,275 | $32,280 | $6,400 | $25,880 |
| 2020 | $1,095 | $27,368 | $6,400 | $20,968 |
| 2019 | $999 | $24,609 | $3,200 | $21,409 |
| 2018 | $782 | $19,260 | $3,200 | $16,060 |
| 2017 | $670 | $16,455 | $3,200 | $13,255 |
| 2016 | $655 | $16,102 | $3,200 | $12,902 |
| 2015 | $595 | $0 | $0 | $0 |
| 2014 | $508 | $12,768 | $3,200 | $9,568 |
Source: Public Records
Map
Nearby Homes
- 4082 Sweetbriar Ln
- 1082 Holly Cir
- 4041 Browne Ct
- 4031 Browne Ct
- 1153 Rocksprings St Unit 3
- 811 Kennesaw Dr
- 4328 Rushmore Place
- 766 Cascade Dr
- 3851 Bonnie Ln SE
- 4226 Oakview Dr
- 1308 Rocksprings St
- 1367 Oakview Cir
- 0 Jonesboro Rd Unit 20166054
- 0 Jonesboro Rd Unit 7690519
- 4436 Hillpine Rd
- 996 Forest Valley Dr SE
- 4368 Rocky View Dr
- 4317 Brookside Dr
- 1101 Lloyd Dr
- 1241 Richmond Ct SE
- 4141 Scott Dr
- 1014 Conley Rd
- 4146 Scott Dr Unit 2
- 4133 Scott Dr
- 4135 David Dr
- 1006 Conley Rd
- 4134 Scott Dr
- 1023 Conley Rd
- 1007 Conley Rd
- 1015 Conley Rd
- 1046 Conley Rd
- 999 Conley Rd
- 4129 David Dr
- 1150 Holly Cir Unit 2
- 998 Conley Rd
- 4117 Scott Dr
- 1054 Conley Rd
- 989 Conley Rd
- 4120 David Dr
- 4192 Mango Ct
Your Personal Tour Guide
Ask me questions while you tour the home.