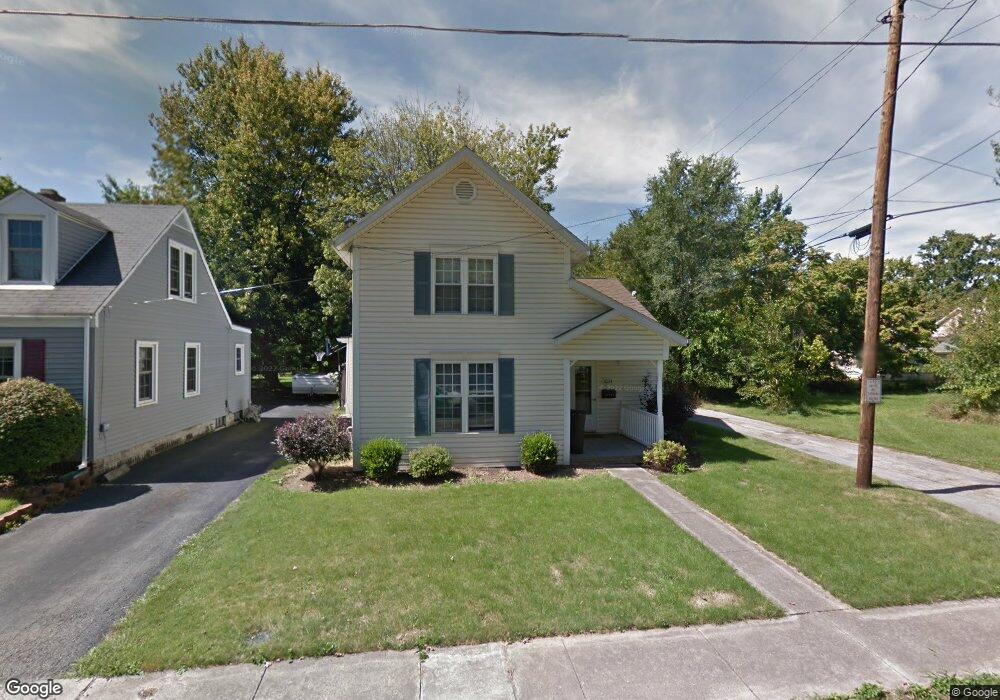
1024 Cypress Ave Findlay, OH 45840
Estimated Value: $128,000 - $152,000
2
Beds
2
Baths
1,509
Sq Ft
$94/Sq Ft
Est. Value
About This Home
This home is located at 1024 Cypress Ave, Findlay, OH 45840 and is currently estimated at $141,635, approximately $93 per square foot. 1024 Cypress Ave is a home located in Hancock County with nearby schools including Whittier Primary School, Bigelow Hill Elementary School, and Glenwood Middle School.
Ownership History
Date
Name
Owned For
Owner Type
Purchase Details
Closed on
May 25, 2023
Sold by
Daniel David R and Daniel Penny S
Bought by
Bouillon Eric D and Bouillon Heidi M
Current Estimated Value
Purchase Details
Closed on
Apr 1, 2014
Sold by
Kreinbrink John L and Kreinbrink Sarah J
Bought by
Daniel David R and Daniel Penny S
Purchase Details
Closed on
Feb 28, 2003
Sold by
Bonner Arthur L
Bought by
Kreinbrink John L and Kreinbrink Sarah J
Purchase Details
Closed on
Aug 17, 1998
Sold by
Kidwell Richard
Bought by
Bonner Arthur and Bonner Cathy
Purchase Details
Closed on
Nov 28, 1994
Sold by
Bowman Gail
Bought by
Ridwell Richard
Home Financials for this Owner
Home Financials are based on the most recent Mortgage that was taken out on this home.
Original Mortgage
$33,440
Interest Rate
7.25%
Mortgage Type
New Conventional
Create a Home Valuation Report for This Property
The Home Valuation Report is an in-depth analysis detailing your home's value as well as a comparison with similar homes in the area
Home Values in the Area
Average Home Value in this Area
Purchase History
| Date | Buyer | Sale Price | Title Company |
|---|---|---|---|
| Bouillon Eric D | $100,000 | Whitman Title | |
| Daniel David R | $89,000 | Attorney | |
| Kreinbrink John L | $66,500 | -- | |
| Bonner Arthur | $57,000 | -- | |
| Ridwell Richard | $35,200 | -- |
Source: Public Records
Mortgage History
| Date | Status | Borrower | Loan Amount |
|---|---|---|---|
| Previous Owner | Ridwell Richard | $33,440 |
Source: Public Records
Tax History
| Year | Tax Paid | Tax Assessment Tax Assessment Total Assessment is a certain percentage of the fair market value that is determined by local assessors to be the total taxable value of land and additions on the property. | Land | Improvement |
|---|---|---|---|---|
| 2024 | $1,410 | $38,670 | $3,800 | $34,870 |
| 2023 | $1,412 | $38,670 | $3,800 | $34,870 |
| 2022 | $1,407 | $38,670 | $3,800 | $34,870 |
| 2021 | $1,050 | $25,130 | $3,790 | $21,340 |
| 2020 | $1,050 | $25,130 | $3,790 | $21,340 |
| 2019 | $1,029 | $25,130 | $3,790 | $21,340 |
| 2018 | $975 | $21,850 | $3,300 | $18,550 |
| 2017 | $488 | $21,850 | $3,300 | $18,550 |
| 2016 | $963 | $21,620 | $3,300 | $18,320 |
| 2015 | $892 | $19,830 | $3,300 | $16,530 |
| 2014 | $892 | $19,830 | $3,300 | $16,530 |
| 2012 | $899 | $19,830 | $3,300 | $16,530 |
Source: Public Records
Map
Nearby Homes
- 204 Laquineo St
- 206 Midland Ave
- 301 Allen Ave
- 322 Midland Ave
- 706 N Cory St
- 145 Madison Ave
- 140 Monroe Ave
- 213 Cherry St
- 420 H St
- 146 Clifton Ave
- 1500 Crystal Ave
- 1820 Gayle Ln
- 716 Winfield Ave
- 421 Clifton Ave
- 912 Parkside Place
- 232 Prentiss Ave
- 523 Center St
- 705 Swing Ave
- 719 Davis St
- 1062 Vincent St
- 1022 Cypress Ave
- 1020 Cypress Ave
- 1016 Cypress Ave
- 153 George St
- 151 George St
- 201 George St
- 147 George St
- 145 George St
- 205 George St
- 1023 Cypress Ave
- 1021 Cypress Ave
- 213 George St
- 1017 Cypress Ave
- 150 Laquineo St
- 217 George St
- 137 George St
- 154 Laquineo St
- 144 Laquineo St
- 148 Laquineo St
- 140 Laquineo St
Your Personal Tour Guide
Ask me questions while you tour the home.