10241 Bellavista Cir Unit 104 Miromar Lakes, FL 33913
Miromar Lakes NeighborhoodEstimated Value: $914,000 - $1,037,000
4
Beds
3
Baths
2,483
Sq Ft
$391/Sq Ft
Est. Value
About This Home
This home is located at 10241 Bellavista Cir Unit 104, Miromar Lakes, FL 33913 and is currently estimated at $970,904, approximately $391 per square foot. 10241 Bellavista Cir Unit 104 is a home located in Lee County with nearby schools including Bonita Springs Elementary School, Allen Park Elementary School, and Edison Park Creative & Expressive Arts School.
Ownership History
Date
Name
Owned For
Owner Type
Purchase Details
Closed on
Apr 22, 2005
Sold by
Bothwell Robert B and Bothwell Karen D
Bought by
Cole Robert M and Cole Anna M
Current Estimated Value
Home Financials for this Owner
Home Financials are based on the most recent Mortgage that was taken out on this home.
Original Mortgage
$487,500
Outstanding Balance
$265,143
Interest Rate
6.62%
Mortgage Type
Fannie Mae Freddie Mac
Estimated Equity
$705,761
Purchase Details
Closed on
Nov 20, 2003
Sold by
Bellavista At Miromar Lakes Ltd Ptnr
Bought by
Bothwell Robert B and Bothwell Karen D
Home Financials for this Owner
Home Financials are based on the most recent Mortgage that was taken out on this home.
Original Mortgage
$896,000
Interest Rate
5.98%
Create a Home Valuation Report for This Property
The Home Valuation Report is an in-depth analysis detailing your home's value as well as a comparison with similar homes in the area
Home Values in the Area
Average Home Value in this Area
Purchase History
| Date | Buyer | Sale Price | Title Company |
|---|---|---|---|
| Cole Robert M | $750,000 | Miromar Title Company Llc | |
| Bothwell Robert B | $560,000 | -- |
Source: Public Records
Mortgage History
| Date | Status | Borrower | Loan Amount |
|---|---|---|---|
| Open | Cole Robert M | $487,500 | |
| Previous Owner | Bothwell Robert B | $896,000 |
Source: Public Records
Tax History Compared to Growth
Tax History
| Year | Tax Paid | Tax Assessment Tax Assessment Total Assessment is a certain percentage of the fair market value that is determined by local assessors to be the total taxable value of land and additions on the property. | Land | Improvement |
|---|---|---|---|---|
| 2025 | $10,552 | $727,372 | -- | -- |
| 2024 | $10,641 | $706,873 | -- | $678,793 |
| 2023 | $10,641 | $558,135 | $0 | $0 |
| 2022 | $9,139 | $507,395 | $0 | $0 |
| 2021 | $8,105 | $461,268 | $0 | $461,268 |
| 2020 | $8,007 | $448,970 | $0 | $448,970 |
| 2019 | $7,989 | $446,548 | $0 | $446,548 |
| 2018 | $8,276 | $447,355 | $0 | $447,355 |
| 2017 | $8,625 | $444,933 | $0 | $444,933 |
| 2016 | $8,131 | $409,130 | $0 | $409,130 |
| 2015 | $8,286 | $419,600 | $0 | $419,600 |
| 2014 | -- | $392,300 | $0 | $392,300 |
| 2013 | -- | $327,600 | $0 | $327,600 |
Source: Public Records
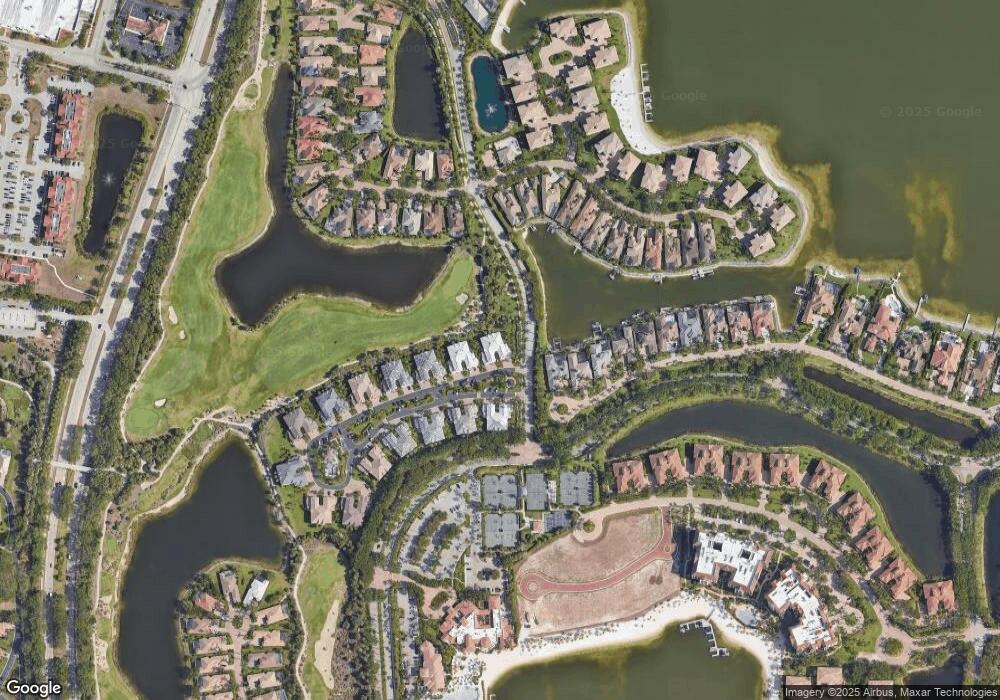
Map
Nearby Homes
- 10221 Bellavista Cir Unit 203
- 10201 Bellavista Cir Unit 301
- 10220 Bellavista Cir Unit 1402
- 10160 Bellavista Cir Unit 1202
- 10130 Bellavista Cir Unit 1004
- 17770 Via Bella Acqua Ct Unit 202
- 10120 Bellavista Cir Unit 904
- 17771 Via Bella Acqua Ct Unit 902
- 10721 Mirasol Dr Unit 601
- 10721 Mirasol Dr Unit 405
- 10721 Mirasol Dr Unit 301
- 10365 Via Balestri Dr Unit III
- 10731 Mirasol Dr Unit 606
- 10731 Mirasol Dr Unit 205
- 10733 Mirasol Dr Unit 311
- 10733 Mirasol Dr Unit 310
- 10731 Mirasol Dr Unit 305
- 10731 Mirasol Dr Unit 505
- 10731 Mirasol Dr Unit 501
- 10731 Mirasol Dr Unit 602
- 10241 Bellavista Cir
- 10241 Bellavista Cir Unit 101
- 10241 Bellavista Cir Unit 103
- 10241 Bellavista Cir Unit 102
- 10221 Bellavista Cir Unit 204
- 10221 Bellavista Cir Unit 202
- 10221 Bellavista Cir Unit 201
- 10240 Bellavista Cir
- 10240 Bellavista Cir Unit 1503
- 10240 Bellavista Cir Unit 1501
- 10240 Bellavista Cir Unit 1504
- 10240 Bellavista Cir Unit 1502
- 10301 Via Anacapri Ct
- 10201 Bellavista Cir Unit 303
- 10201 Bellavista Cir Unit 302
- 10201 Bellavista Cir Unit 304
- 10220 Bellavista Cir Unit 1403
- 10220 Bellavista Cir Unit 1401
- 10220 Bellavista Cir Unit 1404
- 0 Via Anacapari