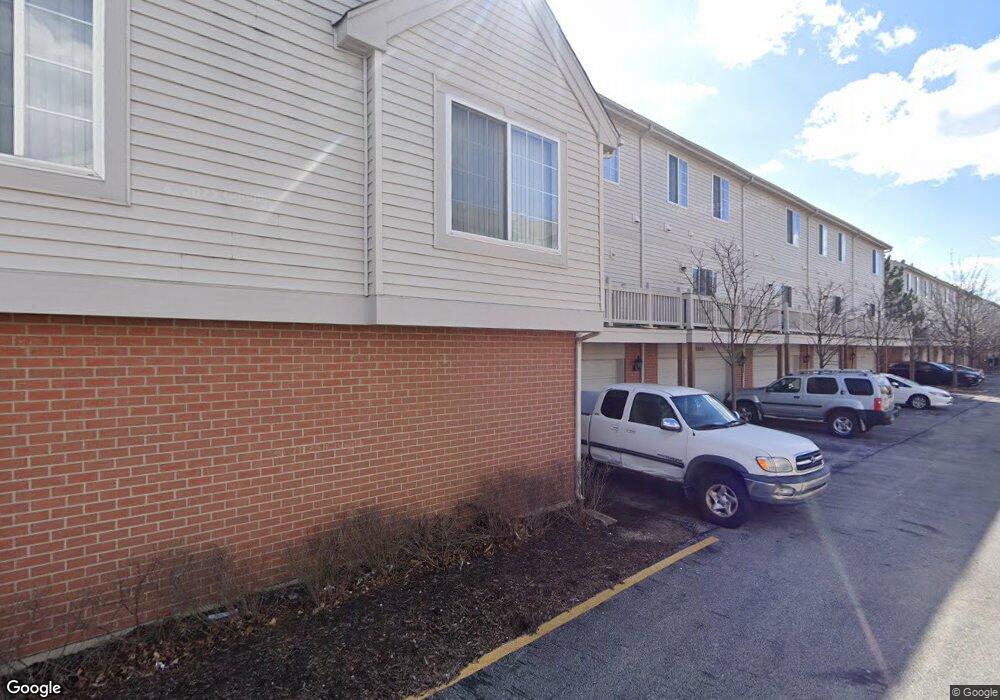
10242 Camden Ln Bridgeview, IL 60455
Estimated Value: $301,000 - $317,381
2
Beds
3
Baths
1,721
Sq Ft
$181/Sq Ft
Est. Value
About This Home
This home is located at 10242 Camden Ln, Bridgeview, IL 60455 and is currently estimated at $311,595, approximately $181 per square foot. 10242 Camden Ln is a home located in Cook County with nearby schools including Sorrick Elementary School, Oak Ridge Elementary School, and H H Conrady Jr High School.
Ownership History
Date
Name
Owned For
Owner Type
Purchase Details
Closed on
May 23, 2017
Sold by
Chicago Title Land Trust Co
Bought by
Nakhleh Linda A and Nakhleh Murad
Current Estimated Value
Purchase Details
Closed on
Aug 30, 2016
Sold by
Mrowca Lucyna
Bought by
Chicagotitle Land Trust Co and Trust Number 8002369886
Purchase Details
Closed on
Jun 5, 2015
Sold by
Hakim Amr Ahmed El and Osman Nazira
Bought by
Peagler Matthew and Peagler Jvonna D
Home Financials for this Owner
Home Financials are based on the most recent Mortgage that was taken out on this home.
Original Mortgage
$160,000
Interest Rate
4.05%
Mortgage Type
New Conventional
Purchase Details
Closed on
Oct 22, 2010
Sold by
Lennar Chicago Inc
Bought by
El Hakim Amr Ahmed
Home Financials for this Owner
Home Financials are based on the most recent Mortgage that was taken out on this home.
Original Mortgage
$159,950
Interest Rate
4.37%
Mortgage Type
New Conventional
Create a Home Valuation Report for This Property
The Home Valuation Report is an in-depth analysis detailing your home's value as well as a comparison with similar homes in the area
Home Values in the Area
Average Home Value in this Area
Purchase History
| Date | Buyer | Sale Price | Title Company |
|---|---|---|---|
| Nakhleh Linda A | -- | Chicago Title Land Trust Com | |
| Chicagotitle Land Trust Co | $161,000 | Citywide Title Corporation | |
| Peagler Matthew | $180,000 | Chicago Title Insurance Co | |
| El Hakim Amr Ahmed | $200,000 | None Available |
Source: Public Records
Mortgage History
| Date | Status | Borrower | Loan Amount |
|---|---|---|---|
| Previous Owner | Peagler Matthew | $160,000 | |
| Previous Owner | El Hakim Amr Ahmed | $159,950 |
Source: Public Records
Tax History Compared to Growth
Tax History
| Year | Tax Paid | Tax Assessment Tax Assessment Total Assessment is a certain percentage of the fair market value that is determined by local assessors to be the total taxable value of land and additions on the property. | Land | Improvement |
|---|---|---|---|---|
| 2024 | $6,864 | $24,136 | $2,850 | $21,286 |
| 2023 | $5,203 | $24,136 | $2,850 | $21,286 |
| 2022 | $5,203 | $16,276 | $2,545 | $13,731 |
| 2021 | $5,119 | $16,276 | $2,545 | $13,731 |
| 2020 | $5,118 | $16,276 | $2,545 | $13,731 |
| 2019 | $4,822 | $15,513 | $2,341 | $13,172 |
| 2018 | $4,709 | $15,513 | $2,341 | $13,172 |
| 2017 | $5,762 | $15,513 | $2,341 | $13,172 |
| 2016 | $4,866 | $14,660 | $2,036 | $12,624 |
| 2015 | $4,559 | $14,660 | $2,036 | $12,624 |
| 2014 | $4,453 | $14,660 | $2,036 | $12,624 |
| 2013 | -- | $16,110 | $2,036 | $14,074 |
Source: Public Records
Map
Nearby Homes
- 10225 Camden Ln Unit K
- 10233 Concord Ln Unit C
- 10300 S Kathy Ct
- 10440 S 75th Ct
- 9901 S 76th Ave
- 7810 W 102nd St
- 7125 Oconnell Dr Unit 102
- 7109 Oconnell Dr Unit 3B
- 7822 W 99th Place
- 7048 Oconnell Dr Unit 3W
- 7048 Oconnell Dr Unit 2E
- 7100 99th St Unit 204
- 9832 Nottingham Ave Unit 5
- 9832 Nottingham Ave Unit 6
- 9812 Nottingham Ave Unit 14A
- 7008 Oconnell Dr Unit 201
- 9829 Nottingham Ave Unit 10
- 7826 W 98th Place
- 10516 Ridge Cove Dr Unit 36C
- 10528 Ridge Cove Dr Unit 11A
- 10242 Camden Ln Unit A
- 10242 Camden Ln Unit E
- 10214 Camden Ln Unit A
- 10214 Camden Ln Unit 1B
- 10214 Camden Ln Unit B
- 10214 Camden Ln
- 10214 Camden Ln Unit E
- 10228 Camden Ln Unit F
- 10228 Camden Ln
- 10228 Camden Ln Unit B
- 10228 Camden Ln Unit D
- 10228 Camden Ln Unit A
- 10228 Camden Ln Unit A
- 10228 Camden Ln Unit E
- 10201L Camden Ln
- 10201I Camden Ln
- 10201C Camden Ln Unit 2505
- 10201 Camden Ln Unit F
- 10201K Camden Ln
- 10201J Camden Ln Unit 2510