Estimated Value: $755,243 - $826,000
5
Beds
3
Baths
3,371
Sq Ft
$233/Sq Ft
Est. Value
About This Home
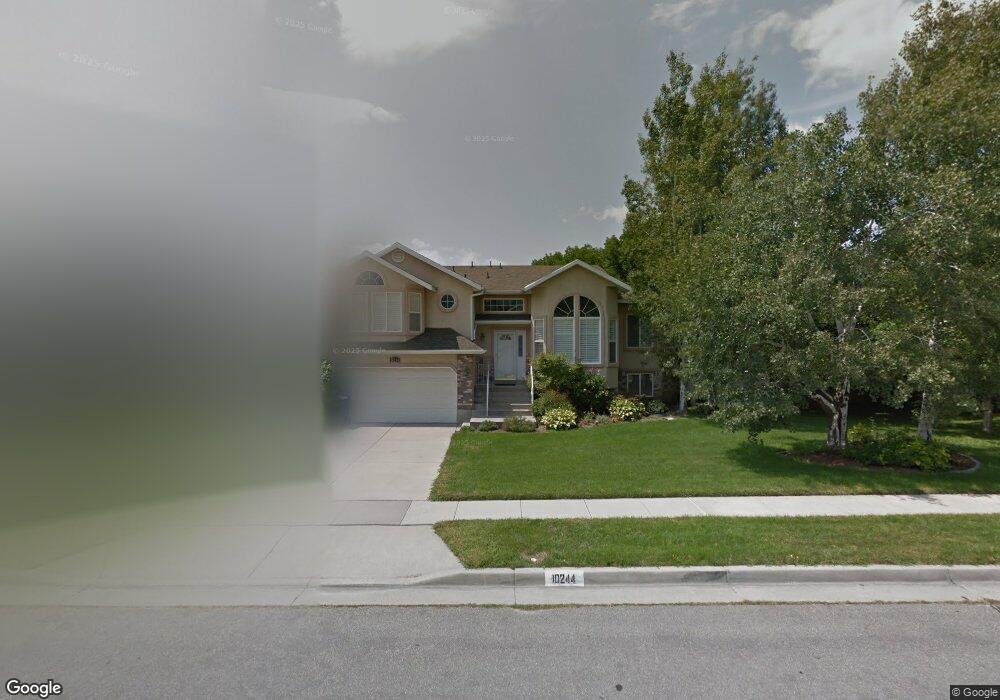
This home is located at 10244 Calla Lily Way, Sandy, UT 84092 and is currently estimated at $787,061, approximately $233 per square foot. 10244 Calla Lily Way is a home located in Salt Lake County with nearby schools including Willow Canyon Elementary School, Eastmont Middle School, and Jordan High.
Ownership History
Date
Name
Owned For
Owner Type
Purchase Details
Closed on
Nov 4, 2005
Sold by
Newsome Dorathy
Bought by
Newsome Dorathy D
Current Estimated Value
Purchase Details
Closed on
Feb 2, 2001
Sold by
Daverio Michael S and Daverio Nancy L
Bought by
Newsome Dorathy
Purchase Details
Closed on
Aug 31, 1995
Sold by
Ouzts Todd L and Ouzts Susan Domm
Bought by
Daverio Michael S and Daverio Nancy L
Home Financials for this Owner
Home Financials are based on the most recent Mortgage that was taken out on this home.
Original Mortgage
$199,750
Interest Rate
7.63%
Create a Home Valuation Report for This Property
The Home Valuation Report is an in-depth analysis detailing your home's value as well as a comparison with similar homes in the area
Home Values in the Area
Average Home Value in this Area
Purchase History
| Date | Buyer | Sale Price | Title Company |
|---|---|---|---|
| Newsome Dorathy D | -- | None Available | |
| Newsome Dorathy | -- | Associated Title | |
| Daverio Michael S | -- | -- |
Source: Public Records
Mortgage History
| Date | Status | Borrower | Loan Amount |
|---|---|---|---|
| Previous Owner | Daverio Michael S | $199,750 |
Source: Public Records
Tax History
| Year | Tax Paid | Tax Assessment Tax Assessment Total Assessment is a certain percentage of the fair market value that is determined by local assessors to be the total taxable value of land and additions on the property. | Land | Improvement |
|---|---|---|---|---|
| 2025 | $3,442 | $673,000 | $303,900 | $369,100 |
| 2024 | $3,442 | $652,900 | $292,500 | $360,400 |
| 2023 | $3,277 | $610,700 | $281,300 | $329,400 |
| 2022 | $3,208 | $584,000 | $275,800 | $308,200 |
| 2021 | $2,853 | $442,300 | $212,100 | $230,200 |
| 2020 | $2,944 | $430,300 | $212,100 | $218,200 |
| 2019 | $3,003 | $427,900 | $200,100 | $227,800 |
| 2016 | $2,600 | $356,600 | $180,300 | $176,300 |
Source: Public Records
Map
Nearby Homes
- 10240 Locksley Rd
- 1420 E Firelight Way
- 10172 Snow Iris Way
- 1602 E Sego Lily Dr
- 10158 Buttercup Dr
- 1650 E Budding Dr
- 9979 S Albury Rd
- 9971 Pinehurst Dr
- 10286 S Edgecliff Dr
- 10538 S Bay Meadow Dr
- 9968 S Blossom Dr
- 9976 Tamara St E
- 1563 E Tameron Dr
- 9828 Pinehurst Dr
- 1584 Petunia Way
- 10695 S Dielsdorf Rd
- 1123 E Sego Lily Dr
- 10673 S Bridlewood Ln
- 1469 Winterwood Cir
- 10517 S Larkspur Dr
- 10234 Calla Lily Way
- 10254 S Calla Lily Way
- 10254 Calla Lily Way
- 10237 Snow Iris Way
- 10251 Snow Iris Way
- 10251 S Snow Iris Way
- 10243 S Calla Lily Way
- 10243 Calla Lily Way
- 10224 Calla Lily Way
- 10253 S Calla Lily Way
- 10231 Snow Iris Way
- 10253 Calla Lily Way
- 10233 Calla Lily Way
- 10272 Calla Lily Way
- 10263 S Calla Lily Way
- 10263 Calla Lily Way
- 10223 S Calla Lily Way
- 10223 Calla Lily Way
- 10214 Calla Lily Way
- 10258 Snow Iris Way
Your Personal Tour Guide
Ask me questions while you tour the home.