Estimated Value: $703,000 - $718,000
5
Beds
3
Baths
3,711
Sq Ft
$191/Sq Ft
Est. Value
About This Home
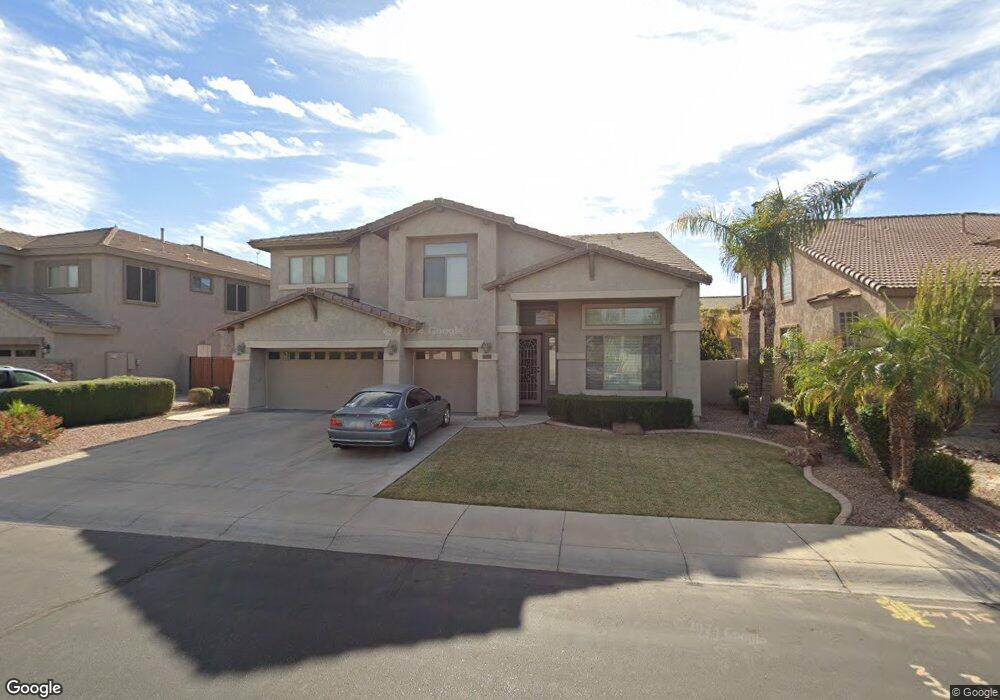
This home is located at 10245 E Lakeview Ave Unit 9, Mesa, AZ 85209 and is currently estimated at $708,345, approximately $190 per square foot. 10245 E Lakeview Ave Unit 9 is a home located in Maricopa County with nearby schools including Augusta Ranch Elementary School, Desert Ridge Jr. High School, and Desert Ridge High School.
Ownership History
Date
Name
Owned For
Owner Type
Purchase Details
Closed on
Sep 21, 2011
Sold by
Netzel Steven M and Netzel Diane M
Bought by
Bacon Bradley A and Bacon Cassandra M
Current Estimated Value
Home Financials for this Owner
Home Financials are based on the most recent Mortgage that was taken out on this home.
Original Mortgage
$231,200
Outstanding Balance
$158,324
Interest Rate
4.26%
Mortgage Type
New Conventional
Estimated Equity
$550,021
Purchase Details
Closed on
Jul 11, 2007
Sold by
Netzel Steven M and Netzel Diane M
Bought by
Netzel Steven M and Netzel Diane M
Purchase Details
Closed on
Oct 27, 2004
Sold by
U S Home Corp
Bought by
Netzel Steven M and Netzel Diane M
Home Financials for this Owner
Home Financials are based on the most recent Mortgage that was taken out on this home.
Original Mortgage
$290,148
Interest Rate
6.64%
Mortgage Type
New Conventional
Create a Home Valuation Report for This Property
The Home Valuation Report is an in-depth analysis detailing your home's value as well as a comparison with similar homes in the area
Purchase History
| Date | Buyer | Sale Price | Title Company |
|---|---|---|---|
| Bacon Bradley A | $289,000 | Lawyers Title Of Arizona Inc | |
| Netzel Steven M | -- | None Available | |
| Netzel Steven M | $337,794 | North American Title Co |
Source: Public Records
Mortgage History
| Date | Status | Borrower | Loan Amount |
|---|---|---|---|
| Open | Bacon Bradley A | $231,200 | |
| Previous Owner | Netzel Steven M | $290,148 | |
| Closed | Netzel Steven M | $54,402 |
Source: Public Records
Tax History
| Year | Tax Paid | Tax Assessment Tax Assessment Total Assessment is a certain percentage of the fair market value that is determined by local assessors to be the total taxable value of land and additions on the property. | Land | Improvement |
|---|---|---|---|---|
| 2025 | $2,656 | $35,859 | -- | -- |
| 2024 | $2,577 | $34,151 | -- | -- |
| 2023 | $2,577 | $48,830 | $9,760 | $39,070 |
| 2022 | $2,514 | $37,070 | $7,410 | $29,660 |
| 2021 | $2,723 | $35,360 | $7,070 | $28,290 |
| 2020 | $2,676 | $33,450 | $6,690 | $26,760 |
| 2019 | $2,480 | $31,610 | $6,320 | $25,290 |
| 2018 | $2,361 | $30,130 | $6,020 | $24,110 |
| 2017 | $2,287 | $29,570 | $5,910 | $23,660 |
| 2016 | $2,371 | $29,180 | $5,830 | $23,350 |
| 2015 | $2,175 | $29,730 | $5,940 | $23,790 |
Source: Public Records
Map
Nearby Homes
- 10162 E Kilarea Ave Unit 2
- 10310 E Kiva Cir Unit 1
- 10114 E Kilarea Ave
- 10054 E Lakeview Ave
- 10152 E Knowles Ave
- 10144 E Knowles Ave
- 10449 E Kiva Ave Unit 3
- 10465 E Knowles Ave
- 10647 E Lindner Cir
- 10306 E Juanita Ave Unit II
- 10411 E Nido Ave
- 10202 E Juanita Ave
- 10625 E Knowles Ave
- 1957 S Talbot Cir
- 10431 E Natal Ave
- 9831 E Lompoc Ave
- 10205 E Nopal Ave
- 10405 E Jan Ave
- 1938 S Noble
- 9818 E Kiva Ave
- 10251 E Lakeview Ave
- 10239 E Lakeview Ave
- 10246 E Lomita Ave Unit 9
- 10252 E Lomita Ave Unit 9
- 10257 E Lakeview Ave
- 10244 E Lakeview Ave
- 10240 E Lomita Ave
- 10238 E Lakeview Ave Unit 9
- 10258 E Lomita Ave Unit 9
- 10250 E Lakeview Ave Unit 9
- 10227 E Lakeview Ave
- 10263 E Lakeview Ave
- 10232 E Lakeview Ave Unit 9
- 10256 E Lakeview Ave Unit 9
- 10264 E Lomita Ave
- 10264 E Lomita Ave
- 10228 E Lomita Ave Unit 9
- 10262 E Lakeview Ave
- 10221 E Lakeview Ave
- 10245 E Lomita Ave Unit 9
Your Personal Tour Guide
Ask me questions while you tour the home.