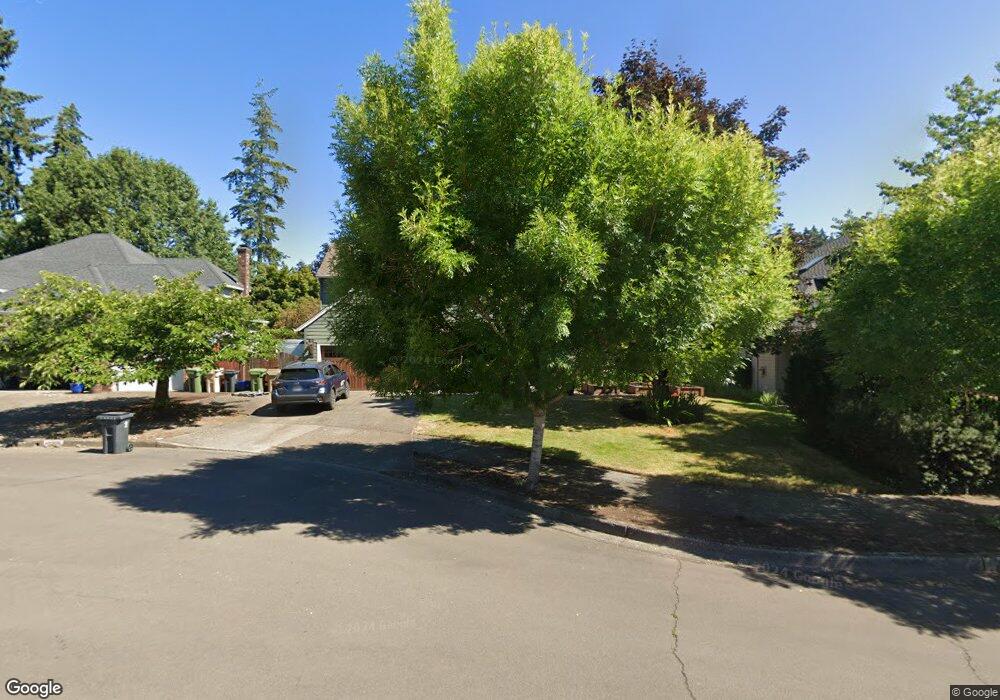
10245 SW Casteel Ct Tualatin, OR 97062
Estimated Value: $709,007 - $753,000
4
Beds
3
Baths
2,582
Sq Ft
$284/Sq Ft
Est. Value
About This Home
This home is located at 10245 SW Casteel Ct, Tualatin, OR 97062 and is currently estimated at $734,002, approximately $284 per square foot. 10245 SW Casteel Ct is a home located in Washington County with nearby schools including Bridgeport Elementary School, Hazelbrook Middle School, and Tualatin High School.
Ownership History
Date
Name
Owned For
Owner Type
Purchase Details
Closed on
Aug 1, 2013
Sold by
Mcauliffe Thomas and Mcauliffe Aimee
Bought by
Voorhies Rawley D and Voorhies Julia A
Current Estimated Value
Home Financials for this Owner
Home Financials are based on the most recent Mortgage that was taken out on this home.
Original Mortgage
$299,200
Outstanding Balance
$218,264
Interest Rate
3.92%
Mortgage Type
New Conventional
Estimated Equity
$515,738
Purchase Details
Closed on
Sep 27, 2007
Sold by
Patton M Brady
Bought by
Mcauliffe Thomas and Mcauliffe Aimee
Purchase Details
Closed on
Aug 30, 2001
Sold by
Martin Tracy E and Martin Linda S
Bought by
Patton M Brady
Home Financials for this Owner
Home Financials are based on the most recent Mortgage that was taken out on this home.
Original Mortgage
$245,000
Interest Rate
7.09%
Create a Home Valuation Report for This Property
The Home Valuation Report is an in-depth analysis detailing your home's value as well as a comparison with similar homes in the area
Home Values in the Area
Average Home Value in this Area
Purchase History
| Date | Buyer | Sale Price | Title Company |
|---|---|---|---|
| Voorhies Rawley D | $374,000 | Fidelity Natl Title Co Of Or | |
| Mcauliffe Thomas | $448,000 | Security Title | |
| Patton M Brady | $281,000 | Fidelity National Title Co |
Source: Public Records
Mortgage History
| Date | Status | Borrower | Loan Amount |
|---|---|---|---|
| Open | Voorhies Rawley D | $299,200 | |
| Previous Owner | Patton M Brady | $245,000 |
Source: Public Records
Tax History Compared to Growth
Tax History
| Year | Tax Paid | Tax Assessment Tax Assessment Total Assessment is a certain percentage of the fair market value that is determined by local assessors to be the total taxable value of land and additions on the property. | Land | Improvement |
|---|---|---|---|---|
| 2025 | $7,310 | $429,770 | -- | -- |
| 2024 | $7,119 | $417,260 | -- | -- |
| 2023 | $7,119 | $405,110 | $0 | $0 |
| 2022 | $6,811 | $405,110 | $0 | $0 |
| 2021 | $6,645 | $381,870 | $0 | $0 |
| 2020 | $6,447 | $370,750 | $0 | $0 |
| 2019 | $6,274 | $359,960 | $0 | $0 |
| 2018 | $6,020 | $349,480 | $0 | $0 |
| 2017 | $5,668 | $339,310 | $0 | $0 |
| 2016 | $5,404 | $329,430 | $0 | $0 |
| 2015 | $5,174 | $319,840 | $0 | $0 |
| 2014 | $4,987 | $310,530 | $0 | $0 |
Source: Public Records
Map
Nearby Homes
- 17473 SW 104th Ave
- 10495 SW Kellogg Dr
- 10609 SW Hazelbrook Rd
- 17895 SW Chippewa Trail
- 17840 SW Shawnee Trail
- 9774 SW Tualatin Rd Unit 203
- 9735 SW Tualatin Rd
- 10763 SW River Dr
- 9700 SW Tualatin Rd Unit 12
- 9700 SW Tualatin Rd Unit 5
- 9700 SW Tualatin Rd Unit 9
- 9811 SW Herman Rd Unit 45
- 10886 SW Bretton Ct
- 9174 SW Waverly Dr
- 9273 SW Sweek Dr
- 11542 SW Royal Villa Dr
- 11444 SW Royal Villa Dr Unit 165
- 9097 SW Sweek Dr
- 11560 SW Royal Villa Dr
- 8720 SW Tualatin Rd Unit 315
- 10225 SW Casteel Ct
- 10265 SW Casteel Ct
- 10240 SW Sedlak Ct
- 10220 SW Sedlak Ct
- 10205 SW Casteel Ctrelisted
- 10205 SW Casteel Ct
- 10285 SW Casteel Ct
- 10260 SW Sedlak Ct
- 10200 SW Sedlak Ct
- 10290 SW Casteel Ct
- 17555 SW Fulton Dr
- 10270 SW Sedlak Ct
- 10250 SW Casteel Ct
- 10195 SW Casteel St
- 10170 SW Sedlak Ct
- 10270 SW Casteel Ct
- 17585 SW Fulton Dr
- 10245 SW Sedlak Ct
- 10225 SW Sedlak Ct
- 10265 SW Sedlak Ct