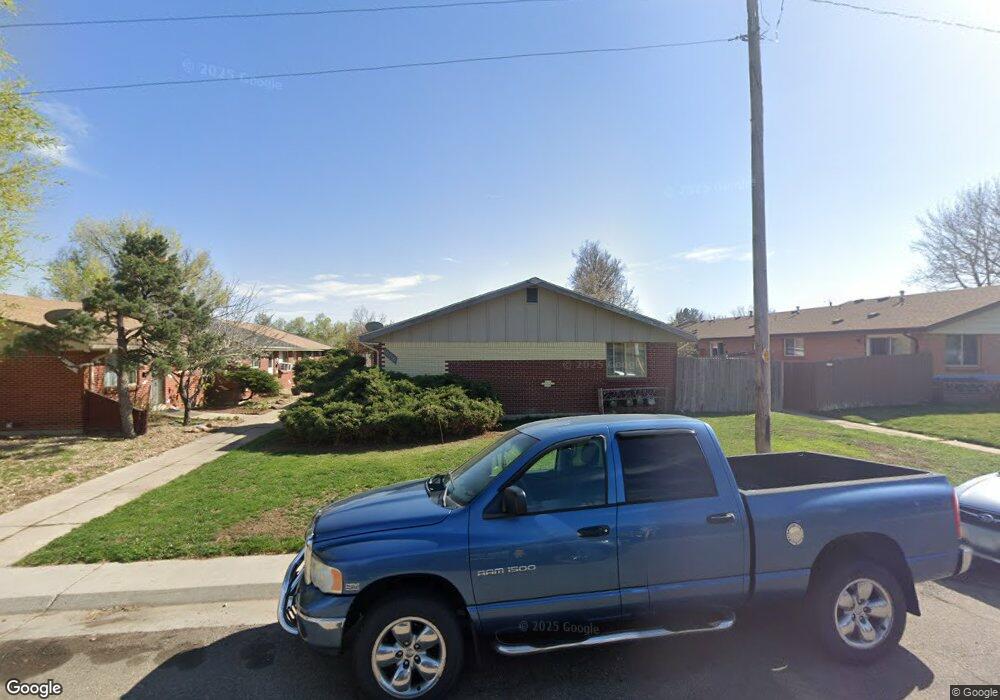
10246 W 59th Place Unit 67 Arvada, CO 80004
Allendale NeighborhoodEstimated Value: $295,000 - $321,429
2
Beds
1
Bath
896
Sq Ft
$347/Sq Ft
Est. Value
About This Home
This home is located at 10246 W 59th Place Unit 67, Arvada, CO 80004 and is currently estimated at $311,357, approximately $347 per square foot. 10246 W 59th Place Unit 67 is a home located in Jefferson County with nearby schools including Vanderhoof Elementary School, Drake Junior High School, and Arvada West High School.
Ownership History
Date
Name
Owned For
Owner Type
Purchase Details
Closed on
Aug 8, 2016
Sold by
Osipov Tatyana
Bought by
Osipov Andrey and Osipov Tatyana
Current Estimated Value
Purchase Details
Closed on
Feb 4, 2010
Sold by
Osipov Andrey and Osipov Tatyana
Bought by
Osipov Tatyana
Purchase Details
Closed on
May 30, 2008
Sold by
Us Bank Na
Bought by
Osipov Andrey and Osipov Tatyana
Purchase Details
Closed on
Apr 2, 2008
Sold by
Nystrom James
Bought by
Us Bank Na
Purchase Details
Closed on
Jan 20, 2006
Sold by
59Th Avene Llc
Bought by
Nystrom James
Home Financials for this Owner
Home Financials are based on the most recent Mortgage that was taken out on this home.
Original Mortgage
$125,300
Interest Rate
7.5%
Mortgage Type
Fannie Mae Freddie Mac
Create a Home Valuation Report for This Property
The Home Valuation Report is an in-depth analysis detailing your home's value as well as a comparison with similar homes in the area
Home Values in the Area
Average Home Value in this Area
Purchase History
| Date | Buyer | Sale Price | Title Company |
|---|---|---|---|
| Osipov Andrey | -- | None Available | |
| Osipov Tatyana | -- | None Available | |
| Osipov Andrey | $51,000 | Land Title Guarantee Company | |
| Us Bank Na | -- | None Available | |
| Nystrom James | $179,000 | Security Title |
Source: Public Records
Mortgage History
| Date | Status | Borrower | Loan Amount |
|---|---|---|---|
| Previous Owner | Nystrom James | $125,300 |
Source: Public Records
Tax History Compared to Growth
Tax History
| Year | Tax Paid | Tax Assessment Tax Assessment Total Assessment is a certain percentage of the fair market value that is determined by local assessors to be the total taxable value of land and additions on the property. | Land | Improvement |
|---|---|---|---|---|
| 2024 | $1,609 | $16,587 | $6,030 | $10,557 |
| 2023 | $1,609 | $16,587 | $6,030 | $10,557 |
| 2022 | $1,377 | $14,059 | $4,170 | $9,889 |
| 2021 | $1,400 | $14,463 | $4,290 | $10,173 |
| 2020 | $1,588 | $16,454 | $4,290 | $12,164 |
| 2019 | $1,566 | $16,454 | $4,290 | $12,164 |
| 2018 | $1,178 | $12,030 | $3,600 | $8,430 |
| 2017 | $1,078 | $12,030 | $3,600 | $8,430 |
| 2016 | $604 | $6,344 | $2,229 | $4,115 |
| 2015 | $344 | $6,344 | $2,229 | $4,115 |
| 2014 | $344 | $3,399 | $2,229 | $1,170 |
Source: Public Records
Map
Nearby Homes
- 10331 W 59th Ave
- 6134 Lee St
- 5870 Nelson Ct
- 5673 Johnson St
- 9487 W 58th Ave Unit B
- 9487 W 58th Ave Unit A
- 6015 Parfet St
- 9546 W 58th Ave Unit B
- 9457 W 58th Ave Unit B
- 6065 Parfet St
- 5890 Holland Ct Unit B
- 5890 Holland Ct Unit A
- 10731 W 63rd Ave Unit A
- 10693 W 63rd Dr Unit 102
- 10694 W 63rd Place
- 6171 Hoyt St
- 10337 W 55th Place Unit 204
- 5544 Lewis St Unit 203
- 6350 Oak St Unit 306
- 6072 Pierson Ct
- 10246 W 59th Place Unit 70
- 10246 W 59th Place Unit 69
- 10246 W 59th Place Unit 68
- 10246 W 59th Place
- 10246 W 59th Place Unit 3
- 10246 W 59th Place Unit 67/1
- 10246 W 59th Place Unit 68-2
- 10246 W 59th Place Unit 70-4
- 10236 W 59th Place Unit 4
- 10236 W 59th Place Unit 3
- 10236 W 59th Place Unit 2
- 10236 W 59th Place Unit 1
- 10236 W 59th Place Unit 72
- 10226 W 59th Place
- 10266 W 59th Place Unit 2
- 10266 W 59th Place Unit 36
- 10266 W 59th Place Unit 35
- 10266 W 59th Place Unit 34
- 10266 W 59th Place Unit 33
- 10266 W 59th Place