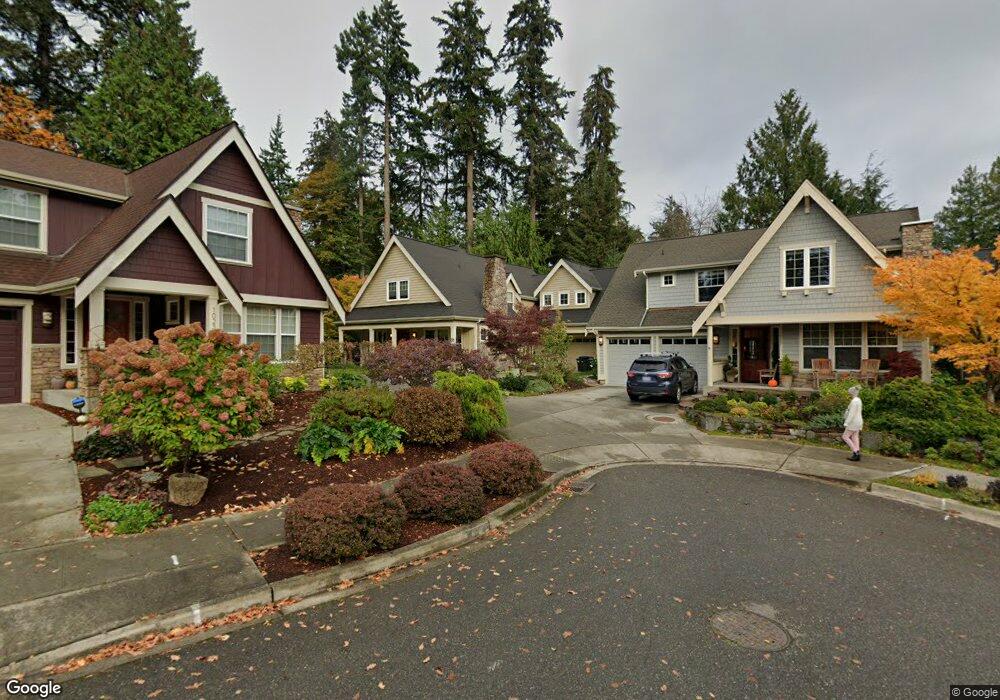
10249 NE Garibaldi Loop Bainbridge Island, WA 98110
Estimated Value: $1,157,839 - $1,367,000
3
Beds
3
Baths
2,387
Sq Ft
$521/Sq Ft
Est. Value
About This Home
This home is located at 10249 NE Garibaldi Loop, Bainbridge Island, WA 98110 and is currently estimated at $1,243,960, approximately $521 per square foot. 10249 NE Garibaldi Loop is a home located in Kitsap County with nearby schools including Bainbridge High School, St. Cecilia Catholic School, and Madrona School.
Ownership History
Date
Name
Owned For
Owner Type
Purchase Details
Closed on
Nov 20, 2013
Sold by
Bare Tammy R and Chen Anna
Bought by
Bihouse 10249 Garibaldi Lp Llc
Current Estimated Value
Purchase Details
Closed on
Oct 26, 2007
Sold by
Bare Tammy R and Chen Anna
Bought by
Bare Tammy R and Chen Anna
Purchase Details
Closed on
Sep 27, 2005
Sold by
Landmark Llc
Bought by
Bare Tammy R and Chen Anna
Home Financials for this Owner
Home Financials are based on the most recent Mortgage that was taken out on this home.
Original Mortgage
$451,820
Interest Rate
5.7%
Mortgage Type
New Conventional
Purchase Details
Closed on
Jul 5, 2005
Sold by
Pryor Antone and Pryor Young Oak
Bought by
Landmark Llc
Home Financials for this Owner
Home Financials are based on the most recent Mortgage that was taken out on this home.
Original Mortgage
$388,309
Interest Rate
5.58%
Mortgage Type
Construction
Create a Home Valuation Report for This Property
The Home Valuation Report is an in-depth analysis detailing your home's value as well as a comparison with similar homes in the area
Home Values in the Area
Average Home Value in this Area
Purchase History
| Date | Buyer | Sale Price | Title Company |
|---|---|---|---|
| Bihouse 10249 Garibaldi Lp Llc | $524,280 | Pacific Northwest Title Silv | |
| Bare Tammy R | -- | None Available | |
| Bare Tammy R | $565,056 | Pacific Nw Title | |
| Landmark Llc | $115,280 | Stewart Title Of Kitsap |
Source: Public Records
Mortgage History
| Date | Status | Borrower | Loan Amount |
|---|---|---|---|
| Previous Owner | Bare Tammy R | $451,820 | |
| Previous Owner | Landmark Llc | $388,309 |
Source: Public Records
Tax History Compared to Growth
Tax History
| Year | Tax Paid | Tax Assessment Tax Assessment Total Assessment is a certain percentage of the fair market value that is determined by local assessors to be the total taxable value of land and additions on the property. | Land | Improvement |
|---|---|---|---|---|
| 2026 | $8,497 | $1,047,530 | $185,730 | $861,800 |
| 2025 | $8,497 | $1,047,530 | $185,730 | $861,800 |
| 2024 | $8,120 | $1,047,530 | $185,730 | $861,800 |
| 2023 | $8,473 | $1,047,530 | $185,730 | $861,800 |
| 2022 | $7,461 | $784,600 | $135,860 | $648,740 |
| 2021 | $7,247 | $726,550 | $125,480 | $601,070 |
| 2020 | $7,345 | $726,550 | $125,480 | $601,070 |
| 2019 | $6,578 | $662,280 | $114,160 | $548,120 |
| 2018 | $6,716 | $577,270 | $99,060 | $478,210 |
| 2017 | $6,039 | $577,270 | $99,060 | $478,210 |
| 2016 | $5,608 | $508,850 | $86,510 | $422,340 |
| 2015 | $4,916 | $453,760 | $86,510 | $367,250 |
| 2014 | -- | $406,540 | $86,510 | $320,030 |
| 2013 | -- | $406,540 | $86,510 | $320,030 |
Source: Public Records
Map
Nearby Homes
- 1349 Nolta Loop NE
- 1351 Nolta Loop NE
- 1322 Polly's Ln
- 300 High School Rd NE Unit 203
- 300 High School Rd NE Unit 419
- 1245 High School Rd NE
- 9380 Ferncliff Ave NE
- 171 Wallace Way NE Unit B
- 620 NE Vineyard Ln Unit B302
- 610 NE Vineyard Ln Unit A104
- 752 NE Vineyard Ln Unit L205
- 774 Madison Ave N Unit B774
- 9641 NE Northtown Loop
- 0 NE Lofgren (Lot A) Rd
- 9418 NE Tidal Ct
- 522 Madrona Way NE Unit 4
- 392 Wills Ln NW
- 1240 Weaver Rd NW Unit B1
- 0 NE New Brooklyn Rd Unit NWM2211912
- 224 Canopy Path NW
- 10257 NE Garibaldi Loop
- 10241 NE Garibaldi Loop
- 10233 NE Garibaldi Loop
- 10265 NE Garibaldi Loop
- 10225 NE Garibaldi Loop
- 10273 NE Garibaldi Loop
- 10268 NE Garibaldi Loop
- 8443 Ferncliff Ave NE
- 10217 NE Garibaldi Loop
- 10286 NE Garibaldi Loop
- 10281 NE Garibaldi Loop
- 10281 NE Garibaldi Loop
- 10244 NE Garibaldi Loop
- 12017 NE Garibaldi Loop
- 10209 NE Garibaldi Loop
- 10298 NE Garibaldi Loop
- 10222 NE Garibaldi Loop
- 0 Lot 7 NE Garibaldi Loop
- 0 Lot 3 NE Garibaldi Loop
- 0 Lot 5 NE Garibaldi Loop