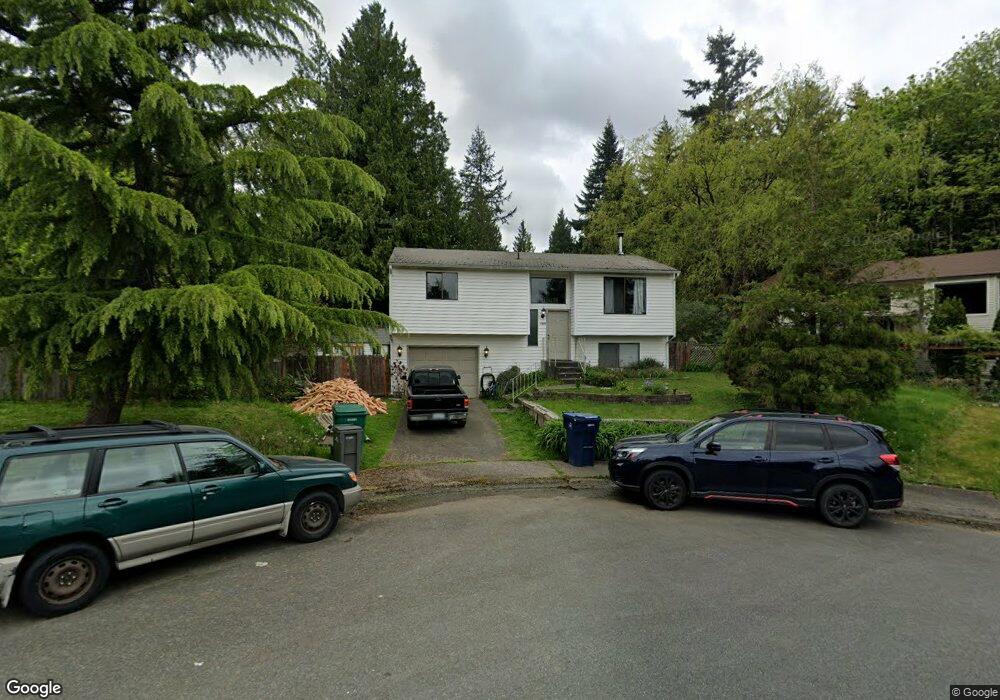
1025 205th Place SE Bothell, WA 98012
Queensborough-Brentwood NeighborhoodEstimated Value: $732,721 - $910,000
2
Beds
3
Baths
1,456
Sq Ft
$551/Sq Ft
Est. Value
About This Home
This home is located at 1025 205th Place SE, Bothell, WA 98012 and is currently estimated at $802,180, approximately $550 per square foot. 1025 205th Place SE is a home located in Snohomish County with nearby schools including Crystal Springs Elementary School, Canyon Park Junior High School, and Bothell High School.
Ownership History
Date
Name
Owned For
Owner Type
Purchase Details
Closed on
May 23, 2003
Sold by
Wilson Connie M and Patterson Jody E
Bought by
Wilson Connie and Patterson Jody
Current Estimated Value
Home Financials for this Owner
Home Financials are based on the most recent Mortgage that was taken out on this home.
Original Mortgage
$179,000
Outstanding Balance
$77,570
Interest Rate
5.75%
Mortgage Type
Purchase Money Mortgage
Estimated Equity
$724,610
Purchase Details
Closed on
Apr 24, 2000
Sold by
Renninger Glenn Robert and Renninger Laura Mae
Bought by
Wilson Connie M and Patterson Jody E
Home Financials for this Owner
Home Financials are based on the most recent Mortgage that was taken out on this home.
Original Mortgage
$148,000
Interest Rate
8.24%
Purchase Details
Closed on
Jun 15, 1994
Sold by
Simonini James T and Simonini Jeanette Ann
Bought by
Renninger Glenn Robert and Renninger Laura Mae
Home Financials for this Owner
Home Financials are based on the most recent Mortgage that was taken out on this home.
Original Mortgage
$113,600
Interest Rate
7.25%
Create a Home Valuation Report for This Property
The Home Valuation Report is an in-depth analysis detailing your home's value as well as a comparison with similar homes in the area
Home Values in the Area
Average Home Value in this Area
Purchase History
| Date | Buyer | Sale Price | Title Company |
|---|---|---|---|
| Wilson Connie | -- | Lawyers Title Agency | |
| Wilson Connie M | $185,000 | -- | |
| Renninger Glenn Robert | $142,000 | -- |
Source: Public Records
Mortgage History
| Date | Status | Borrower | Loan Amount |
|---|---|---|---|
| Open | Wilson Connie | $179,000 | |
| Closed | Wilson Connie M | $148,000 | |
| Previous Owner | Renninger Glenn Robert | $113,600 |
Source: Public Records
Tax History Compared to Growth
Tax History
| Year | Tax Paid | Tax Assessment Tax Assessment Total Assessment is a certain percentage of the fair market value that is determined by local assessors to be the total taxable value of land and additions on the property. | Land | Improvement |
|---|---|---|---|---|
| 2025 | $533 | $624,500 | $460,000 | $164,500 |
| 2024 | $533 | $614,500 | $450,000 | $164,500 |
| 2023 | $501 | $795,000 | $620,000 | $175,000 |
| 2022 | $619 | $522,100 | $369,000 | $153,100 |
| 2020 | $657 | $435,500 | $305,000 | $130,500 |
| 2019 | $3,855 | $378,100 | $250,000 | $128,100 |
| 2018 | $3,620 | $334,600 | $220,000 | $114,600 |
| 2017 | $3,082 | $292,000 | $187,000 | $105,000 |
| 2016 | $2,952 | $270,700 | $170,000 | $100,700 |
| 2015 | $2,990 | $258,400 | $160,000 | $98,400 |
| 2013 | $2,750 | $206,200 | $128,000 | $78,200 |
Source: Public Records
Map
Nearby Homes
- 20411 14th Dr SE
- 807 Grimes Rd
- 20318 Bothell Everett Hwy Unit A303
- 20320 Bothell Everett Hwy Unit D204
- 20320 Bothell Everett Hwy Unit D301
- 20022 7th Ave SE
- 20018 7th Ave SE
- 20029 7th Ave SE
- 1529 201st Place SE Unit 12C
- 19722 Filbert Dr Unit 3
- 19722 Filbert Dr Unit B-5
- 19722 Filbert Dr Unit 9
- 803 211th Place SE
- 721 211th Place SE
- 317 207th St SE
- 20025 6th Dr SE
- 309 207th Place SE
- The Huntington A Plan at Harvest Trails
- The Kingston Plan at Harvest Trails
- The Claremont B Plan at Harvest Trails
- 1029 205th Place SE
- 1017 205th Place SE
- 20511 Greening Rd
- 1028 205th Place SE
- 1009 205th Place SE
- 1024 205th Place SE
- 1020 205th Place SE
- 20509 Greening Rd
- 20512 11th Dr SE
- 20518 11th Dr SE
- 20614 11th Dr SE
- 1001 205th Place SE
- 20506 11th Dr SE
- 20522 11th Dr SE
- 1005 207th Place SE
- 1002 205th Place SE
- 1003 207th Place SE
- 20611 11th Dr SE
- 20432 11th Dr SE
- 20626 11th Dr SE