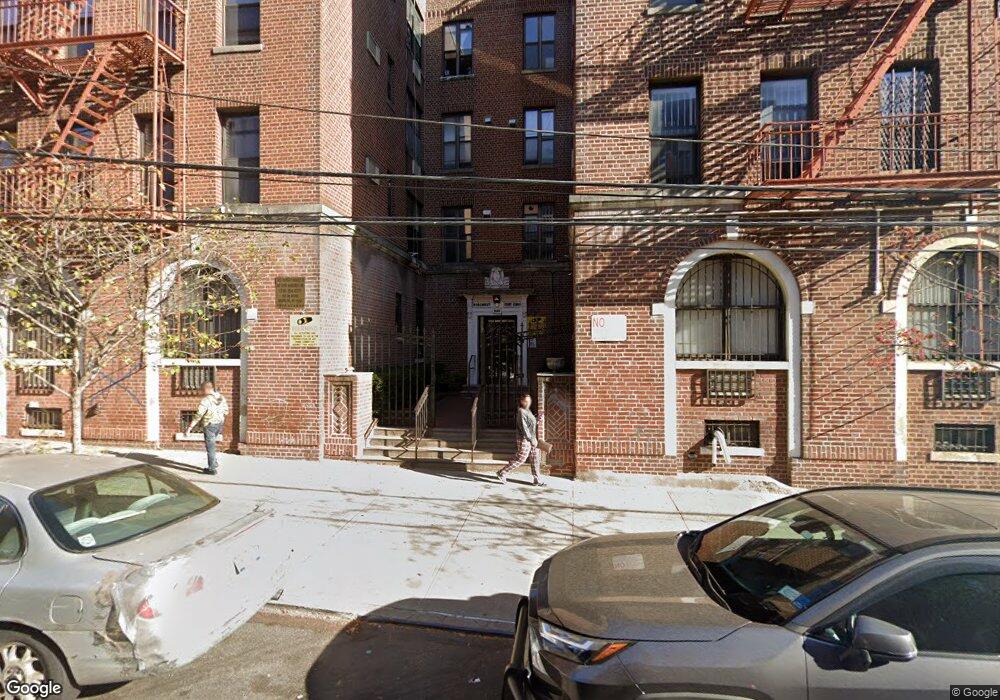
1025 45th St Unit 3C Brooklyn, NY 11219
Borough Park NeighborhoodEstimated Value: $348,177 - $513,000
--
Bed
--
Bath
470
Sq Ft
$930/Sq Ft
Est. Value
About This Home
This home is located at 1025 45th St Unit 3C, Brooklyn, NY 11219 and is currently estimated at $437,044, approximately $929 per square foot. 1025 45th St Unit 3C is a home located in Kings County with nearby schools including P.S. 131 Brooklyn, IS 220 John J. Pershing, and Kehilath Yakov Pupa.
Ownership History
Date
Name
Owned For
Owner Type
Purchase Details
Closed on
Aug 29, 2005
Sold by
Wei Angela and Wei Riche
Bought by
Jiang Jing Deng and Lin Eying
Current Estimated Value
Home Financials for this Owner
Home Financials are based on the most recent Mortgage that was taken out on this home.
Original Mortgage
$100,000
Outstanding Balance
$53,298
Interest Rate
5.79%
Mortgage Type
Purchase Money Mortgage
Estimated Equity
$383,746
Purchase Details
Closed on
Sep 18, 2003
Sold by
Wong Man Ling Ada
Bought by
Wei Angela and Wei Riche
Purchase Details
Closed on
Nov 10, 2000
Sold by
Tan Tong Kwon and Kok Maggie
Bought by
Wong Man Ling Ada
Home Financials for this Owner
Home Financials are based on the most recent Mortgage that was taken out on this home.
Original Mortgage
$61,000
Interest Rate
7.52%
Mortgage Type
Purchase Money Mortgage
Create a Home Valuation Report for This Property
The Home Valuation Report is an in-depth analysis detailing your home's value as well as a comparison with similar homes in the area
Home Values in the Area
Average Home Value in this Area
Purchase History
| Date | Buyer | Sale Price | Title Company |
|---|---|---|---|
| Jiang Jing Deng | $160,000 | -- | |
| Jiang Jing Deng | $160,000 | -- | |
| Wei Angela | $140,000 | -- | |
| Wei Angela | $140,000 | -- | |
| Wong Man Ling Ada | $83,000 | Regal Title Agency | |
| Wong Man Ling Ada | $83,000 | Regal Title Agency |
Source: Public Records
Mortgage History
| Date | Status | Borrower | Loan Amount |
|---|---|---|---|
| Open | Jiang Jing Deng | $100,000 | |
| Closed | Jiang Jing Deng | $100,000 | |
| Previous Owner | Wong Man Ling Ada | $61,000 |
Source: Public Records
Tax History Compared to Growth
Tax History
| Year | Tax Paid | Tax Assessment Tax Assessment Total Assessment is a certain percentage of the fair market value that is determined by local assessors to be the total taxable value of land and additions on the property. | Land | Improvement |
|---|---|---|---|---|
| 2025 | $1,954 | $21,688 | $1,573 | $20,115 |
| 2024 | $1,954 | $20,931 | $1,573 | $19,358 |
| 2023 | $1,813 | $19,857 | $1,573 | $18,284 |
| 2022 | $1,680 | $18,326 | $1,573 | $16,753 |
| 2021 | $1,443 | $14,389 | $1,573 | $12,816 |
| 2020 | $1,594 | $16,703 | $1,573 | $15,130 |
| 2019 | $1,497 | $16,703 | $1,573 | $15,130 |
| 2018 | $1,381 | $15,080 | $1,573 | $13,507 |
| 2017 | $1,344 | $13,790 | $1,573 | $12,217 |
| 2016 | $1,113 | $14,198 | $1,573 | $12,625 |
| 2015 | $439 | $11,793 | $1,573 | $10,220 |
| 2014 | $439 | $11,077 | $1,573 | $9,504 |
Source: Public Records
Map
Nearby Homes
- 1025 45th St Unit 4D
- 1025 45th St Unit 3F
- 4409 New Utrecht Ave
- 4518 11th Ave
- 933 45th St
- 921 45th St
- 4107 New Utrecht Ave
- 4105 New Utrecht Ave
- 4103 10th Ave
- 4313 9th Ave Unit 1A
- 4019 10th Ave
- 902 46th St
- 4709 New Utrecht Ave
- 4726 New Utrecht Ave
- 902 42nd St
- 4906 Fort Hamilton Pkwy
- 913 48th St
- 911 48th St
- 854 44th St
- 1026 39th St
- 1025 45th St Unit 2D
- 1025 45th St Unit 4F
- 1025 45th St Unit 4E
- 1025 45th St Unit 4C
- 1025 45th St Unit 4B
- 1025 45th St Unit 4A
- 1025 45th St Unit 3G
- 1025 45th St Unit 3E
- 1025 45th St Unit 3D
- 1025 45th St Unit 3B
- 1025 45th St Unit 3A
- 1025 45th St Unit 2G
- 1025 45th St Unit 2F
- 1025 45th St Unit 2E
- 1025 45th St Unit 2C
- 1025 45th St Unit 2B
- 1025 45th St Unit 2A
- 1025 45th St Unit 1E
- 1025 45th St Unit 1D
- 1025 45th St Unit 1C