Estimated Value: $296,000 - $344,000
3
Beds
2
Baths
1,344
Sq Ft
$238/Sq Ft
Est. Value
About This Home
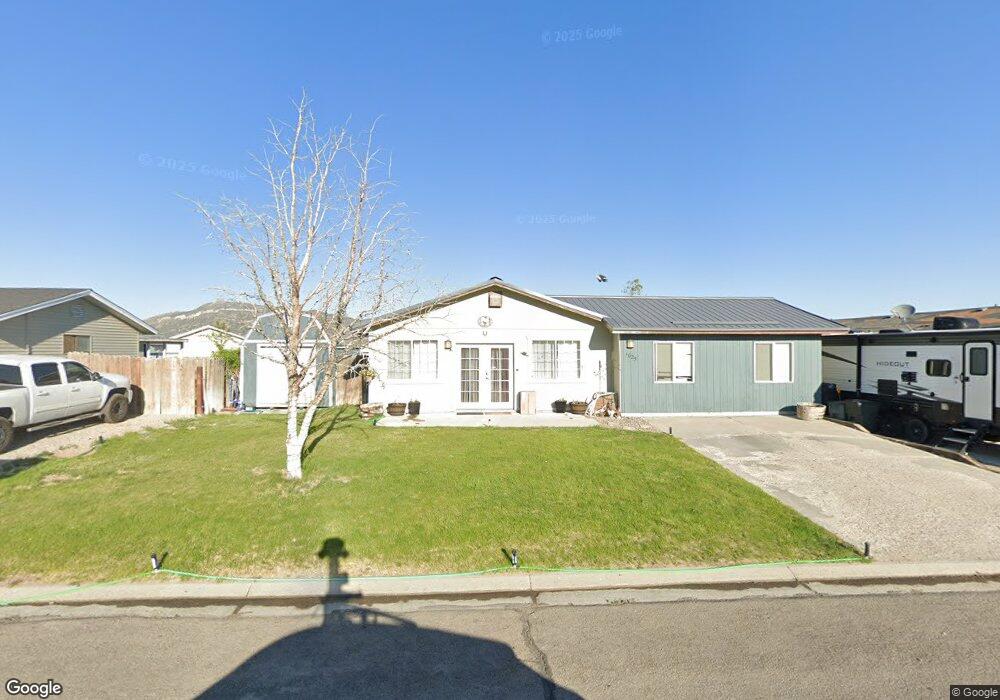
This home is located at 1025 77th St E, Ely, NV 89301 and is currently estimated at $320,049, approximately $238 per square foot. 1025 77th St E is a home located in White Pine County with nearby schools including McGill Elementary School, White Pine Middle School, and White Pine High School.
Ownership History
Date
Name
Owned For
Owner Type
Purchase Details
Closed on
Jul 15, 2011
Sold by
Lyon Jed C and Lyon Andrea
Bought by
Cracraft Kellen D
Current Estimated Value
Home Financials for this Owner
Home Financials are based on the most recent Mortgage that was taken out on this home.
Original Mortgage
$131,577
Outstanding Balance
$89,822
Interest Rate
4.5%
Mortgage Type
FHA
Estimated Equity
$230,227
Purchase Details
Closed on
Nov 24, 2010
Sold by
Green Lake Group Llc
Bought by
Lyon Jed C and Lyon Andrea
Home Financials for this Owner
Home Financials are based on the most recent Mortgage that was taken out on this home.
Original Mortgage
$112,261
Interest Rate
3.75%
Mortgage Type
FHA
Purchase Details
Closed on
Mar 10, 2006
Sold by
Sloat Joan
Bought by
Green Lake Group Llc and Green Lake Croup, Llc
Create a Home Valuation Report for This Property
The Home Valuation Report is an in-depth analysis detailing your home's value as well as a comparison with similar homes in the area
Home Values in the Area
Average Home Value in this Area
Purchase History
| Date | Buyer | Sale Price | Title Company |
|---|---|---|---|
| Cracraft Kellen D | $135,000 | Stewart Title Company Of Nev | |
| Lyon Jed C | $123,500 | Sstewart Title Of Nevada, 66 | |
| Green Lake Group Llc | -- | -- |
Source: Public Records
Mortgage History
| Date | Status | Borrower | Loan Amount |
|---|---|---|---|
| Open | Cracraft Kellen D | $131,577 | |
| Previous Owner | Lyon Jed C | $112,261 |
Source: Public Records
Tax History
| Year | Tax Paid | Tax Assessment Tax Assessment Total Assessment is a certain percentage of the fair market value that is determined by local assessors to be the total taxable value of land and additions on the property. | Land | Improvement |
|---|---|---|---|---|
| 2025 | $1,737 | $46,373 | $4,385 | $41,988 |
| 2024 | $1,737 | $47,315 | $4,385 | $42,930 |
| 2023 | $1,737 | $43,672 | $4,070 | $39,602 |
| 2022 | $1,494 | $39,841 | $4,070 | $35,771 |
| 2021 | $1,420 | $38,326 | $4,070 | $34,256 |
| 2020 | $1,279 | $37,942 | $3,755 | $34,187 |
| 2019 | $1,242 | $32,960 | $3,755 | $29,205 |
| 2018 | $1,224 | $32,461 | $3,755 | $28,706 |
| 2017 | $1,210 | $32,922 | $3,755 | $29,167 |
| 2016 | $1,176 | $30,528 | $4,726 | $25,802 |
| 2015 | $1,102 | $30,501 | $4,569 | $25,932 |
| 2014 | $1,102 | $30,240 | $4,437 | $25,803 |
Source: Public Records
Map
Nearby Homes
- TBD S Industrial Way
- 700 E 93rd N
- 800 E 93rd N
- 0 Us Highway 93 and Sr 490 Unit 11628071
- 323 40th North St
- 2032 N Mcgill Hwy
- 237 Fairview Ln
- 0 U S 93
- TBD U S 93
- 1100 Avenue C
- 1151 Avenue H
- 1124 Avenue H
- 920 E Aultman St
- 842 E Aultman St
- 927 Park Ave
- 747 Avenue D
- 945 Avenue K
- 925 Avenue K
- 2295 North St
- 736 Avenue G
Your Personal Tour Guide
Ask me questions while you tour the home.