M
Landlord's Agent in 2022
Maggie Goldman
Coldwell Banker Realty
(404) 804-6405
2 in this area
27 Total Sales
Estimated Value: $813,631 - $956,000
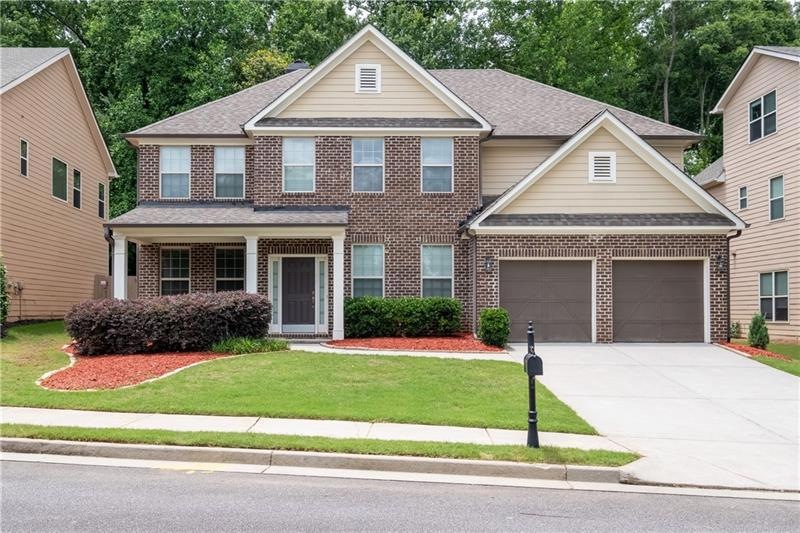
Enjoy this spacious home minutes from downtown Crabapple. This 5 bedroom, 3 bathroom home has everything you need! Open concept living area for you to engage with your family and guests while preparing meals in the kitchen which has so much storage, walk in pantry, stainless steel appliances, double ovens, great island with seating, quartz counters and hardwood floors throughout. Living room, breakfast area and backyard are all excellent for entertaining. Fenced backyard for privacy and covered patio for relaxing. Separate dining room, office and guest bedroom suite complete the first floor. Upstairs you will find 4 bedrooms and a great loft area! Large Primary bedroom with elegant ensuite with separate vanities, garden soaking tub, separate shower and walk-in closet. Attendance zone for Crabapple Crossing, Northwestern MS & Milton HS. Close to downtown Alpharetta, Avalon, downtown Roswell, Wills Park & Pool, I-400 and Hwy 9. Could offer move in between August 5 and 8 right before school starts. *All showings are paused while reviewing applications*
Last Agent to Rent the Property
Coldwell Banker Realty License #359839 Listed on: 06/10/2022

| Date | Buyer | Sale Price | Title Company |
|---|---|---|---|
| Geethakumarisna Shyam | $320,418 | -- |
| Date | Event | Price | List to Sale | Price per Sq Ft |
|---|---|---|---|---|
| 06/16/2022 06/16/22 | Rented | $3,500 | 0.0% | -- |
| 06/10/2022 06/10/22 | For Rent | $3,500 | -- | -- |
| Year | Tax Paid | Tax Assessment Tax Assessment Total Assessment is a certain percentage of the fair market value that is determined by local assessors to be the total taxable value of land and additions on the property. | Land | Improvement |
|---|---|---|---|---|
| 2025 | $1,385 | $279,920 | $29,320 | $250,600 |
| 2023 | $6,981 | $247,320 | $37,480 | $209,840 |
| 2022 | $3,599 | $192,280 | $44,600 | $147,680 |
| 2021 | $4,273 | $153,160 | $34,960 | $118,200 |
| 2020 | $4,365 | $223,120 | $11,840 | $211,280 |
| 2019 | $708 | $152,400 | $27,880 | $124,520 |
| 2018 | $3,672 | $148,800 | $27,200 | $121,600 |
| 2017 | $3,544 | $136,520 | $9,360 | $127,160 |
| 2016 | $3,526 | $136,520 | $9,360 | $127,160 |
| 2015 | $4,283 | $136,520 | $9,360 | $127,160 |
| 2014 | $3,356 | $122,240 | $8,360 | $113,880 |
M
Landlord's Agent in 2022
Maggie Goldman
Coldwell Banker Realty
(404) 804-6405
2 in this area
27 Total Sales
G
Tenant's Agent in 2022
Gabriel Young
Kasper Realty Professionals, LLC.
(678) 521-8987
14 Total Sales
Source: First Multiple Listing Service (FMLS)
MLS Number: 7064135
APN: 22-4020-1241-058-7
Disclaimer: Certain information contained herein is derived from information provided by parties other than Homes.com. All information provided is deemed reliable, but is not guaranteed to be accurate and should be independently verified.
![]() Listings identified with the FMLS IDX logo come from FMLS and are held by brokerage firms other than the owner of this website. The listing brokerage is identified in any listing details. Information is deemed reliable but is not guaranteed. If you believe any FMLS listing contains material that infringes your copyrighted work please visit www.fmls.com/dmca to review our DMCA policy and learn how to submit a takedown request. © 2025 First Multiple Listing Service, Inc.
Listings identified with the FMLS IDX logo come from FMLS and are held by brokerage firms other than the owner of this website. The listing brokerage is identified in any listing details. Information is deemed reliable but is not guaranteed. If you believe any FMLS listing contains material that infringes your copyrighted work please visit www.fmls.com/dmca to review our DMCA policy and learn how to submit a takedown request. © 2025 First Multiple Listing Service, Inc.