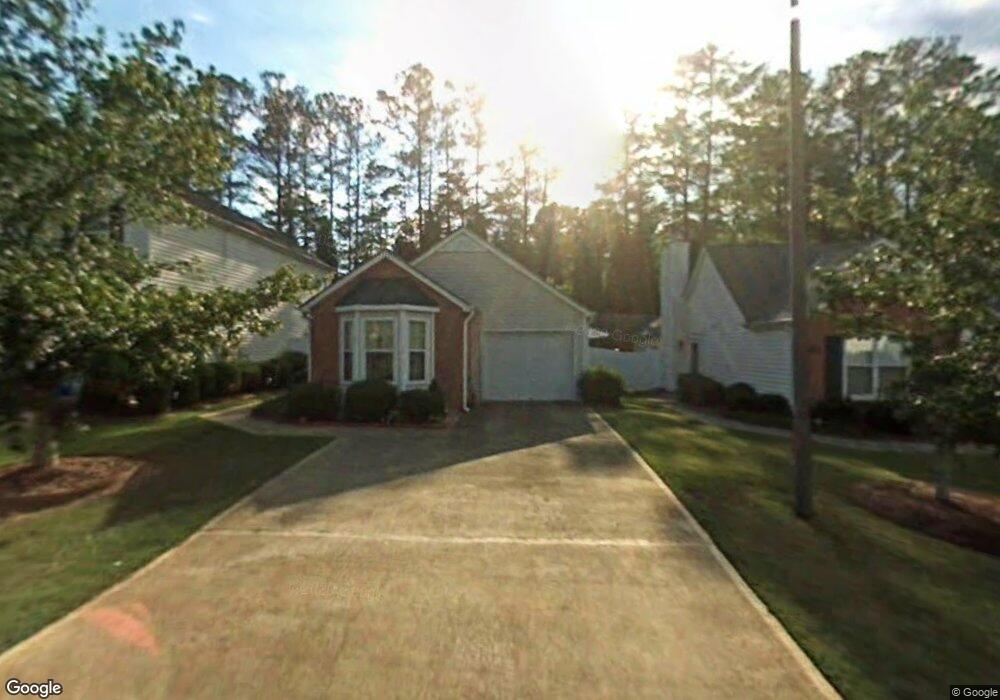
1025 Daventry Crossing Unit 1 Woodstock, GA 30188
Estimated Value: $311,000 - $312,972
2
Beds
2
Baths
1,058
Sq Ft
$295/Sq Ft
Est. Value
About This Home
This home is located at 1025 Daventry Crossing Unit 1, Woodstock, GA 30188 and is currently estimated at $311,986, approximately $294 per square foot. 1025 Daventry Crossing Unit 1 is a home located in Cherokee County with nearby schools including Arnold Mill Elementary School, Mill Creek Middle School, and River Ridge High School.
Ownership History
Date
Name
Owned For
Owner Type
Purchase Details
Closed on
May 31, 2006
Sold by
Polt Millicent
Bought by
Espriella Marcela
Current Estimated Value
Home Financials for this Owner
Home Financials are based on the most recent Mortgage that was taken out on this home.
Original Mortgage
$122,265
Outstanding Balance
$76,509
Interest Rate
7.95%
Mortgage Type
New Conventional
Estimated Equity
$235,477
Purchase Details
Closed on
Feb 14, 2003
Sold by
Bennett Bonnie B
Bought by
Polt Millicent
Home Financials for this Owner
Home Financials are based on the most recent Mortgage that was taken out on this home.
Original Mortgage
$92,500
Interest Rate
5.75%
Mortgage Type
New Conventional
Purchase Details
Closed on
May 28, 1998
Sold by
Calumet Homes Lp
Bought by
Bennett Bonnie B
Home Financials for this Owner
Home Financials are based on the most recent Mortgage that was taken out on this home.
Original Mortgage
$79,400
Interest Rate
7.02%
Mortgage Type
New Conventional
Create a Home Valuation Report for This Property
The Home Valuation Report is an in-depth analysis detailing your home's value as well as a comparison with similar homes in the area
Home Values in the Area
Average Home Value in this Area
Purchase History
| Date | Buyer | Sale Price | Title Company |
|---|---|---|---|
| Espriella Marcela | $135,000 | -- | |
| Polt Millicent | $117,500 | -- | |
| Bennett Bonnie B | $99,400 | -- |
Source: Public Records
Mortgage History
| Date | Status | Borrower | Loan Amount |
|---|---|---|---|
| Open | Espriella Marcela | $122,265 | |
| Previous Owner | Polt Millicent | $92,500 | |
| Previous Owner | Bennett Bonnie B | $79,400 |
Source: Public Records
Tax History Compared to Growth
Tax History
| Year | Tax Paid | Tax Assessment Tax Assessment Total Assessment is a certain percentage of the fair market value that is determined by local assessors to be the total taxable value of land and additions on the property. | Land | Improvement |
|---|---|---|---|---|
| 2025 | $613 | $123,216 | $25,200 | $98,016 |
| 2024 | $594 | $120,036 | $25,200 | $94,836 |
| 2023 | $422 | $109,060 | $24,000 | $85,060 |
| 2022 | $539 | $93,720 | $20,000 | $73,720 |
| 2021 | $531 | $79,220 | $16,000 | $63,220 |
| 2020 | $500 | $70,444 | $12,000 | $58,444 |
| 2019 | $476 | $63,880 | $12,000 | $51,880 |
| 2018 | $446 | $53,720 | $12,000 | $41,720 |
| 2017 | $439 | $124,500 | $12,000 | $37,800 |
| 2016 | $407 | $112,700 | $9,600 | $35,480 |
| 2015 | $399 | $107,500 | $9,600 | $33,400 |
| 2014 | $357 | $96,400 | $9,600 | $28,960 |
Source: Public Records
Map
Nearby Homes
- 126 Heron Crossing
- 403 Heron Landing
- 313 Derrymore Dr
- 1070 Daventry Crossing
- 421 Stovall Place
- 601 Cork St
- 424 Loblolly St
- 422 Stovall Place
- 920 Lucky Ln
- 106 Pioneer Dr
- 130 Cherecobb Dr
- 415 Bellehaven Ln
- 146 Bellehaven Dr
- 3465 Township Ridge Point
- 504 E Lake Ct
- 454 Mountain View Ln
- 109 Wiley Parc Cir
- 1021 Daventry Crossing
- 1031 Daventry Crossing
- 1019 Daventry Crossing
- 1033 Daventry Crossing
- 1017 Daventry Crossing
- 531 Audubon Cir
- 1035 Daventry Crossing Unit I
- 1015 Daventry Crossing
- 200 Daventry Way
- 201 Daventry Way
- 1037 Daventry Crossing
- 202 Daventry Way Unit 202
- 202 Daventry Way
- 202 Daventry Way
- 1013 Daventry Crossing
- 203 Daventry Way
- 1039 Daventry Crossing
- 1010 Daventry Crossing
- 1011 Daventry Crossing Unit 1
- 204 Daventry Way