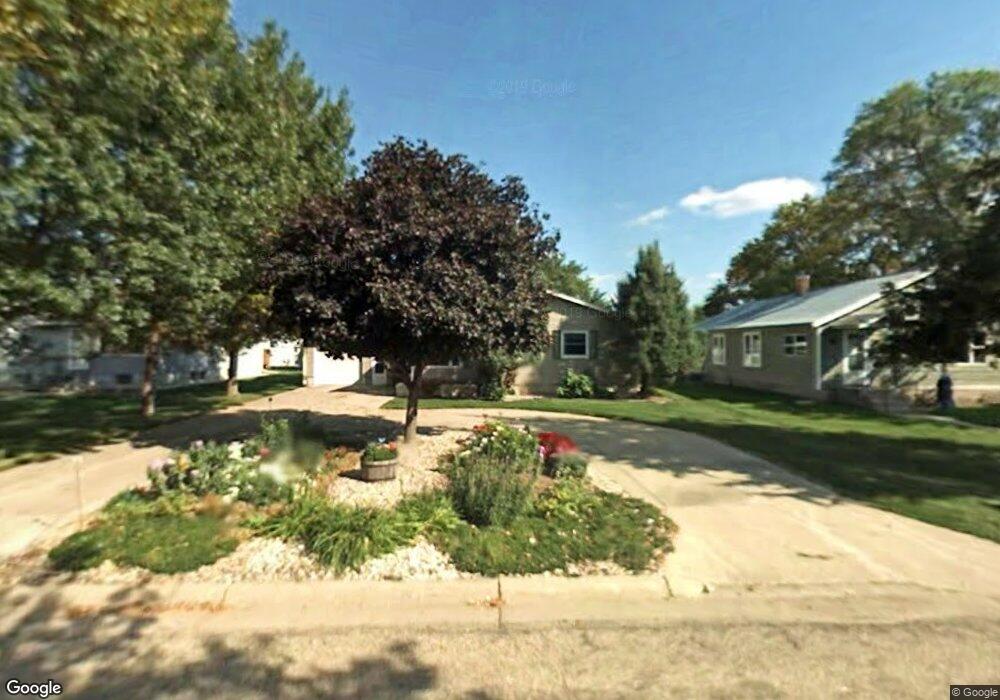
1025 E 2nd St Redfield, SD 57469
Estimated Value: $172,000 - $304,000
2
Beds
2
Baths
1,684
Sq Ft
$141/Sq Ft
Est. Value
About This Home
This home is located at 1025 E 2nd St, Redfield, SD 57469 and is currently estimated at $237,193, approximately $140 per square foot. 1025 E 2nd St is a home located in Spink County with nearby schools including Redfield Elementary School, Redfield Junior High School, and Redfield High School.
Ownership History
Date
Name
Owned For
Owner Type
Purchase Details
Closed on
Jul 16, 2018
Bought by
Frankenstein Danene
Current Estimated Value
Purchase Details
Closed on
Aug 4, 2016
Bought by
Newman Milton L and Newman Devonna K
Purchase Details
Closed on
Feb 22, 2012
Sold by
Thompson Dorothy J
Bought by
Boyer William E and Boyer Paula K
Home Financials for this Owner
Home Financials are based on the most recent Mortgage that was taken out on this home.
Original Mortgage
$140,600
Interest Rate
4.01%
Mortgage Type
Stand Alone First
Create a Home Valuation Report for This Property
The Home Valuation Report is an in-depth analysis detailing your home's value as well as a comparison with similar homes in the area
Purchase History
| Date | Buyer | Sale Price | Title Company |
|---|---|---|---|
| Frankenstein Danene | $194,000 | -- | |
| Newman Milton L | $174,000 | -- | |
| Boyer William E | -- | -- |
Source: Public Records
Mortgage History
| Date | Status | Borrower | Loan Amount |
|---|---|---|---|
| Previous Owner | Boyer William E | $140,600 |
Source: Public Records
Tax History
| Year | Tax Paid | Tax Assessment Tax Assessment Total Assessment is a certain percentage of the fair market value that is determined by local assessors to be the total taxable value of land and additions on the property. | Land | Improvement |
|---|---|---|---|---|
| 2025 | $4,712 | $234,269 | $7,114 | $227,155 |
| 2023 | $4,301 | $226,467 | $5,928 | $220,539 |
| 2022 | $4,152 | $198,250 | $4,560 | $193,690 |
| 2021 | $3,684 | $191,450 | $4,560 | $186,890 |
| 2020 | $3,423 | $172,192 | $4,560 | $167,632 |
| 2019 | $3,425 | $158,164 | $4,340 | $153,824 |
| 2018 | $3,338 | $147,680 | $4,340 | $143,340 |
| 2017 | $2,897 | $134,962 | $4,342 | $130,620 |
| 2016 | $2,947 | $118,294 | $4,342 | $113,952 |
| 2015 | -- | $118,294 | $4,342 | $113,952 |
| 2014 | -- | $118,294 | $4,342 | $113,952 |
| 2013 | -- | $123,423 | $4,342 | $119,081 |
Source: Public Records
Map
Nearby Homes
Your Personal Tour Guide
Ask me questions while you tour the home.