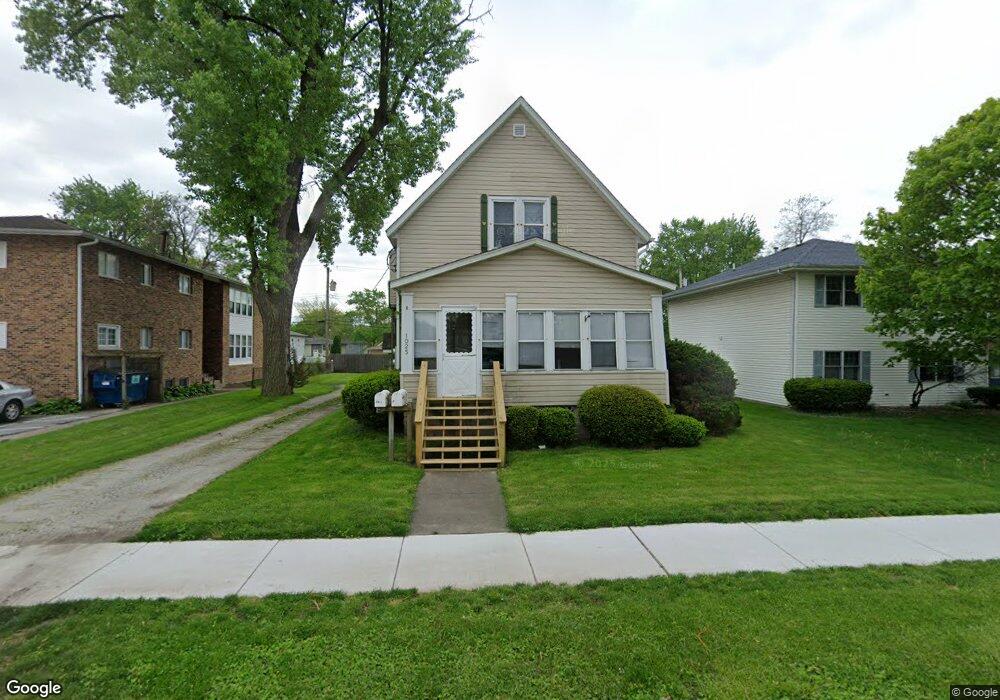
1025 E Glen Park Ave Griffith, IN 46319
Estimated Value: $236,212 - $309,000
3
Beds
2
Baths
1,816
Sq Ft
$147/Sq Ft
Est. Value
About This Home
This home is located at 1025 E Glen Park Ave, Griffith, IN 46319 and is currently estimated at $267,053, approximately $147 per square foot. 1025 E Glen Park Ave is a home located in Lake County with nearby schools including Griffith Senior High School, Calumet Christian School, and St Mary School.
Ownership History
Date
Name
Owned For
Owner Type
Purchase Details
Closed on
Feb 19, 2014
Sold by
Porter Christopher A
Bought by
Cap Enerprises Llc
Current Estimated Value
Purchase Details
Closed on
Mar 9, 2009
Sold by
Lasalle Bank National Association
Bought by
Porter Christopher A
Purchase Details
Closed on
May 2, 2008
Sold by
Arreola Sergio
Bought by
Lasalle Bank Na and First Franklin Mortgage Loan Trust 2007-
Purchase Details
Closed on
Aug 30, 2005
Sold by
Skeans Michael
Bought by
Arreola Sergio
Home Financials for this Owner
Home Financials are based on the most recent Mortgage that was taken out on this home.
Original Mortgage
$125,000
Interest Rate
7.99%
Mortgage Type
Fannie Mae Freddie Mac
Create a Home Valuation Report for This Property
The Home Valuation Report is an in-depth analysis detailing your home's value as well as a comparison with similar homes in the area
Home Values in the Area
Average Home Value in this Area
Purchase History
| Date | Buyer | Sale Price | Title Company |
|---|---|---|---|
| Cap Enerprises Llc | -- | None Available | |
| Porter Christopher A | -- | None Available | |
| Lasalle Bank Na | $89,985 | None Available | |
| Arreola Sergio | -- | Chicago Title Insurance Comp |
Source: Public Records
Mortgage History
| Date | Status | Borrower | Loan Amount |
|---|---|---|---|
| Previous Owner | Arreola Sergio | $125,000 |
Source: Public Records
Tax History
| Year | Tax Paid | Tax Assessment Tax Assessment Total Assessment is a certain percentage of the fair market value that is determined by local assessors to be the total taxable value of land and additions on the property. | Land | Improvement |
|---|---|---|---|---|
| 2025 | $4,736 | $223,300 | $35,000 | $188,300 |
| 2024 | $6,597 | $213,500 | $35,000 | $178,500 |
| 2023 | $4,352 | $201,400 | $35,000 | $166,400 |
| 2022 | $4,352 | $187,400 | $35,000 | $152,400 |
| 2021 | $2,072 | $103,600 | $28,300 | $75,300 |
| 2020 | $2,072 | $103,600 | $28,300 | $75,300 |
| 2019 | $2,117 | $103,600 | $28,300 | $75,300 |
| 2018 | $2,568 | $103,600 | $28,300 | $75,300 |
| 2017 | $2,806 | $103,600 | $28,300 | $75,300 |
| 2016 | $2,962 | $103,600 | $28,300 | $75,300 |
| 2014 | $3,017 | $103,600 | $28,300 | $75,300 |
| 2013 | $3,594 | $120,000 | $21,500 | $98,500 |
Source: Public Records
Map
Nearby Homes
- 722 N Oakwood St
- 703 N Glenwood Ave
- 706 N Colfax St
- 415 N Wood St
- 937 N Wood St
- 902 N Wood St
- 1115 N Oakwood St
- 719 N Indiana St
- 1218 N Glenwood Ave
- 1213 N Jay Ave
- 747 N Lafayette St
- 5706 W 43rd Ave
- 715 N Harvey St
- 231 Minter Dr
- 1138 N Broad St
- 1412 N Dwiggins Ave
- 310 N Jay St
- 816 E 39th Ln
- 225 N Dwiggins St
- 408 N Griffith Blvd
- 917 E Glen Park Ave Unit 1W
- 917 E Glen Park Ave
- 917 E 45th Ave
- 1002 E Ash Place
- 1006 E Ash Place
- 1010 E Ash Place
- 935 E Glen Park Ave Unit 301
- 826 N Oakwood St
- 906 N Oakwood St
- 1017 E Glen Park Ave
- 903 N Oakwood St
- 931 E Glen Park Ave Unit 203
- 931 E Glen Park Ave Unit 307
- 931 E Glen Park Ave Unit 302
- 835 N Arbogast St
- 916 E Glen Park Ave
- 1016 E Ash Place
- 1030 E Glen Park Ave
- 916 E 45th Ave
- 903 E Glen Park Ave
Your Personal Tour Guide
Ask me questions while you tour the home.