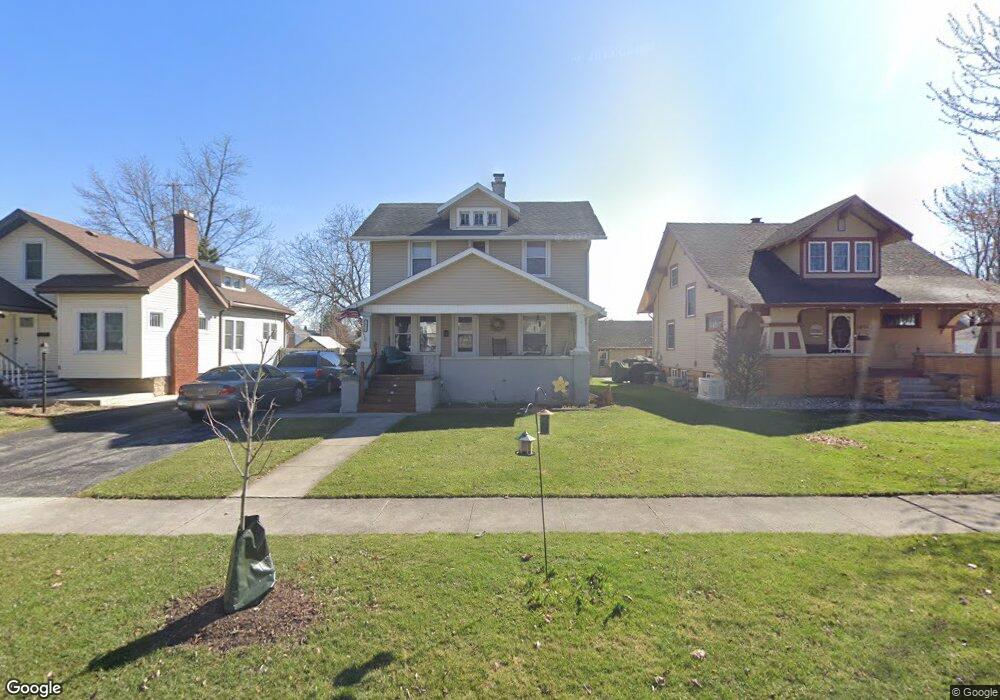
1025 Hurd Ave Findlay, OH 45840
Estimated Value: $147,000 - $160,000
3
Beds
1
Bath
1,144
Sq Ft
$132/Sq Ft
Est. Value
About This Home
This home is located at 1025 Hurd Ave, Findlay, OH 45840 and is currently estimated at $151,405, approximately $132 per square foot. 1025 Hurd Ave is a home located in Hancock County with nearby schools including Lincoln Elementary School, Donnell Middle School, and Findlay High School.
Ownership History
Date
Name
Owned For
Owner Type
Purchase Details
Closed on
Jun 3, 1999
Sold by
Wanamaker K Roger
Bought by
Wolford Michael and Wolford Patricia
Current Estimated Value
Home Financials for this Owner
Home Financials are based on the most recent Mortgage that was taken out on this home.
Original Mortgage
$72,000
Interest Rate
6.58%
Mortgage Type
Balloon
Purchase Details
Closed on
Jul 16, 1997
Sold by
May Glenn
Bought by
Wolford Michael
Purchase Details
Closed on
Aug 14, 1989
Bought by
Wanamaker K Roger
Create a Home Valuation Report for This Property
The Home Valuation Report is an in-depth analysis detailing your home's value as well as a comparison with similar homes in the area
Home Values in the Area
Average Home Value in this Area
Purchase History
| Date | Buyer | Sale Price | Title Company |
|---|---|---|---|
| Wolford Michael | $50,000 | -- | |
| Wolford Michael | $50,000 | -- | |
| Wanamaker K Roger | -- | -- |
Source: Public Records
Mortgage History
| Date | Status | Borrower | Loan Amount |
|---|---|---|---|
| Closed | Wolford Michael | $72,000 | |
| Closed | Wolford Michael | $0 |
Source: Public Records
Tax History Compared to Growth
Tax History
| Year | Tax Paid | Tax Assessment Tax Assessment Total Assessment is a certain percentage of the fair market value that is determined by local assessors to be the total taxable value of land and additions on the property. | Land | Improvement |
|---|---|---|---|---|
| 2024 | $1,337 | $37,650 | $7,670 | $29,980 |
| 2023 | $1,340 | $37,650 | $7,670 | $29,980 |
| 2022 | $1,335 | $37,650 | $7,670 | $29,980 |
| 2021 | $1,570 | $38,580 | $7,850 | $30,730 |
| 2020 | $1,570 | $38,580 | $7,850 | $30,730 |
| 2019 | $1,538 | $38,580 | $7,850 | $30,730 |
| 2018 | $1,427 | $32,790 | $5,530 | $27,260 |
| 2017 | $713 | $32,790 | $5,530 | $27,260 |
| 2016 | $1,750 | $32,790 | $5,530 | $27,260 |
| 2015 | $735 | $16,800 | $5,530 | $11,270 |
| 2014 | $735 | $16,800 | $5,530 | $11,270 |
| 2012 | $743 | $16,800 | $5,530 | $11,270 |
Source: Public Records
Map
Nearby Homes