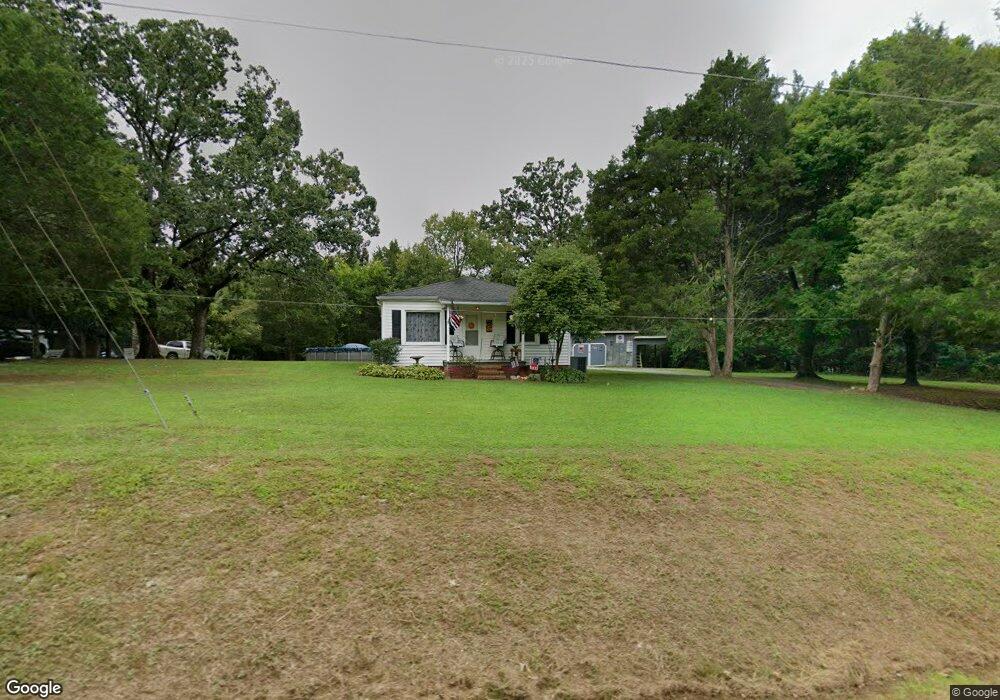
1025 Lentz Rd China Grove, NC 28023
Estimated Value: $146,000 - $175,000
--
Bed
1
Bath
780
Sq Ft
$210/Sq Ft
Est. Value
About This Home
This home is located at 1025 Lentz Rd, China Grove, NC 28023 and is currently estimated at $163,998, approximately $210 per square foot. 1025 Lentz Rd is a home located in Rowan County with nearby schools including Bostian Elementary School, China Grove Middle School, and Jesse C Carson High School.
Ownership History
Date
Name
Owned For
Owner Type
Purchase Details
Closed on
Jun 25, 2021
Sold by
Eudy Ricky D and Eudy Darlene Annette
Bought by
Whitten Ruth Trexler
Current Estimated Value
Home Financials for this Owner
Home Financials are based on the most recent Mortgage that was taken out on this home.
Original Mortgage
$122,000
Outstanding Balance
$111,114
Interest Rate
3.15%
Mortgage Type
New Conventional
Estimated Equity
$52,884
Purchase Details
Closed on
Nov 30, 2005
Sold by
Fulcher Bennie R
Bought by
Eudy Ricky D and Eudy Annette F
Home Financials for this Owner
Home Financials are based on the most recent Mortgage that was taken out on this home.
Original Mortgage
$33,600
Interest Rate
4.75%
Mortgage Type
Fannie Mae Freddie Mac
Purchase Details
Closed on
Sep 7, 2005
Sold by
Fulcher Earnestine J
Bought by
Fulcher Bennie R
Create a Home Valuation Report for This Property
The Home Valuation Report is an in-depth analysis detailing your home's value as well as a comparison with similar homes in the area
Home Values in the Area
Average Home Value in this Area
Purchase History
| Date | Buyer | Sale Price | Title Company |
|---|---|---|---|
| Whitten Ruth Trexler | $120,000 | None Available | |
| Eudy Ricky D | $42,000 | -- | |
| Fulcher Bennie R | -- | -- |
Source: Public Records
Mortgage History
| Date | Status | Borrower | Loan Amount |
|---|---|---|---|
| Open | Whitten Ruth Trexler | $122,000 | |
| Previous Owner | Eudy Ricky D | $33,600 |
Source: Public Records
Tax History Compared to Growth
Tax History
| Year | Tax Paid | Tax Assessment Tax Assessment Total Assessment is a certain percentage of the fair market value that is determined by local assessors to be the total taxable value of land and additions on the property. | Land | Improvement |
|---|---|---|---|---|
| 2025 | $638 | $95,228 | $30,940 | $64,288 |
| 2024 | $638 | $95,228 | $30,940 | $64,288 |
| 2023 | $638 | $95,228 | $30,940 | $64,288 |
| 2022 | $420 | $56,160 | $25,194 | $30,966 |
| 2021 | $417 | $56,160 | $25,194 | $30,966 |
| 2020 | $417 | $56,160 | $25,194 | $30,966 |
| 2019 | $417 | $56,160 | $25,194 | $30,966 |
| 2018 | $374 | $50,774 | $25,194 | $25,580 |
| 2017 | $374 | $50,774 | $25,194 | $25,580 |
| 2016 | $374 | $50,774 | $25,194 | $25,580 |
| 2015 | $379 | $50,774 | $25,194 | $25,580 |
| 2014 | $367 | $51,508 | $25,194 | $26,314 |
Source: Public Records
Map
Nearby Homes
- 1660 Lentz Rd
- 1280 Elm Forest Ln
- 1307 Elm Forest Ln
- 1306 Elm Forest Ln
- 1274 Elm Forest Ln
- 1256 Elm Forest Ln
- 1202 Elm Forest Ln
- 1231 Elm Forest Ln
- 2143 Stephens Farm Dr
- 1213 Elm Forest Ln
- Fairview Plan at Liberty Grove - Single Family Homes
- Woodford Plan at Liberty Grove - Single Family Homes
- Poplar Plan at Liberty Grove - Single Family Homes
- Lily Plan at Liberty Grove - Single Family Homes
- Dogwood Plan at Liberty Grove - Single Family Homes
- Marigold Plan at Liberty Grove - Single Family Homes
- Iris Plan at Liberty Grove - Single Family Homes
- Rosewood Plan at Liberty Grove - Single Family Homes
- 1813 Millstream Dr
- 1819 Millstream Dr