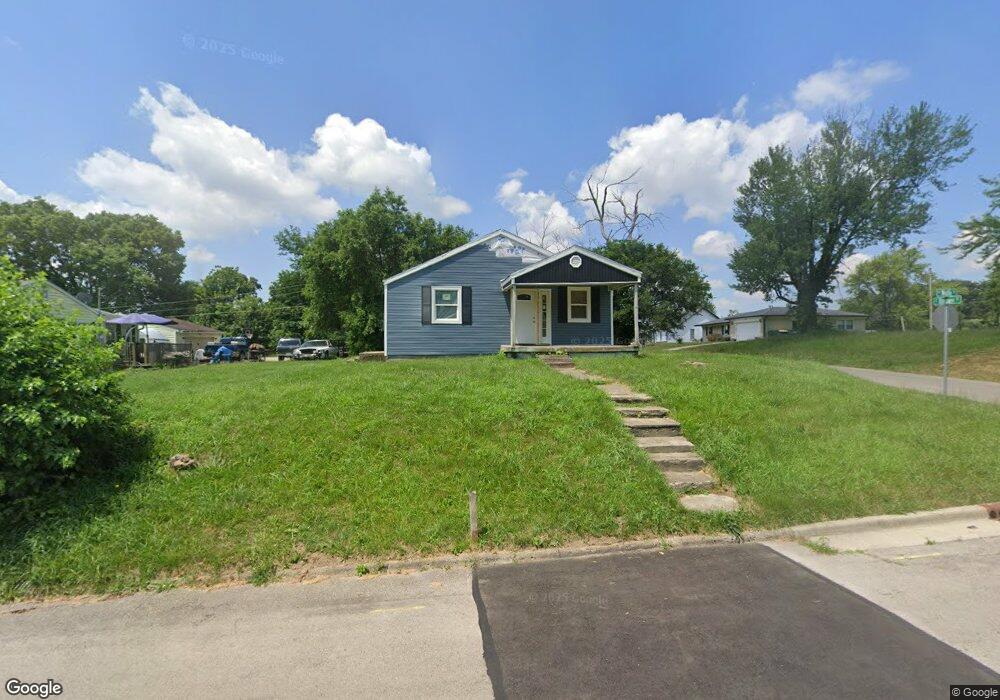
1025 N Wolfe St Muncie, IN 47303
Whitely NeighborhoodEstimated Value: $55,000 - $88,000
2
Beds
1
Bath
1,004
Sq Ft
$73/Sq Ft
Est. Value
About This Home
This home is located at 1025 N Wolfe St, Muncie, IN 47303 and is currently estimated at $72,883, approximately $72 per square foot. 1025 N Wolfe St is a home located in Delaware County with nearby schools including Longfellow Elementary School, Muncie Central High School, and Northside Middle School.
Ownership History
Date
Name
Owned For
Owner Type
Purchase Details
Closed on
May 9, 2024
Sold by
Branson Angela
Bought by
Branson Family Trust and Branson
Current Estimated Value
Purchase Details
Closed on
May 8, 2024
Sold by
Branson De Juan
Bought by
Branson Angela Denise
Purchase Details
Closed on
Mar 7, 2023
Sold by
Abner James
Bought by
Branson Angela
Purchase Details
Closed on
Jan 11, 2022
Sold by
Harris Billy D and Harris Rosie I
Bought by
Abner James
Purchase Details
Closed on
Jun 25, 2010
Sold by
Richardson James W
Bought by
Harris Billy D and Harris Rosie I
Purchase Details
Closed on
Oct 11, 2006
Sold by
Stewardship Fund Lp
Bought by
Richardson Ii James W
Purchase Details
Closed on
May 20, 2005
Sold by
J P Morgan Chase Bank
Bought by
Stewardshi Fund Lp
Purchase Details
Closed on
Jan 18, 2005
Sold by
Turner Jordan W
Bought by
Jpmorgan Chase Bank
Create a Home Valuation Report for This Property
The Home Valuation Report is an in-depth analysis detailing your home's value as well as a comparison with similar homes in the area
Home Values in the Area
Average Home Value in this Area
Purchase History
| Date | Buyer | Sale Price | Title Company |
|---|---|---|---|
| Branson Family Trust | -- | None Listed On Document | |
| Branson Angela Denise | -- | None Listed On Document | |
| Branson Angela | $10,000 | -- | |
| Abner James | -- | None Listed On Document | |
| Harris Billy D | -- | None Available | |
| Richardson Ii James W | -- | Chicago Title | |
| Stewardshi Fund Lp | -- | Investors Titlecorp | |
| Jpmorgan Chase Bank | $15,020 | None Available |
Source: Public Records
Mortgage History
| Date | Status | Borrower | Loan Amount |
|---|---|---|---|
| Closed | Richardson Ii James W | $0 |
Source: Public Records
Tax History
| Year | Tax Paid | Tax Assessment Tax Assessment Total Assessment is a certain percentage of the fair market value that is determined by local assessors to be the total taxable value of land and additions on the property. | Land | Improvement |
|---|---|---|---|---|
| 2025 | $434 | $40,300 | $4,600 | $35,700 |
| 2024 | $434 | $16,300 | $4,600 | $11,700 |
| 2023 | $411 | $17,300 | $3,800 | $13,500 |
| 2022 | $251 | $14,300 | $3,800 | $10,500 |
| 2021 | $264 | $15,600 | $4,300 | $11,300 |
| 2020 | $263 | $15,500 | $4,200 | $11,300 |
| 2019 | $273 | $16,500 | $4,200 | $12,300 |
| 2018 | $275 | $16,700 | $4,400 | $12,300 |
| 2017 | $266 | $15,800 | $4,800 | $11,000 |
| 2016 | $266 | $15,800 | $4,800 | $11,000 |
| 2014 | $197 | $15,400 | $4,800 | $10,600 |
| 2013 | -- | $15,300 | $4,800 | $10,500 |
Source: Public Records
Map
Nearby Homes
- 906 N Wolfe St
- 1311 E Butler St
- 822 N Wolfe St
- 1607 E Butler St
- 1311 E Hines St
- 1416 E Kirk St
- 1805 E Carver Dr
- 1007 N Central Ave
- 925 N Central Ave
- 304 N Hackley St
- 1335 E Washington St
- 409 N Pershing Dr
- 2101 N Macedonia Ave
- 2000 Doctor Martin Luther King Junior Blvd
- 1125 E Washington St
- 320 N Vine St
- 1508 E Main St
- 735 N Elm St
- 513 E Centennial Ave
- 647 N Elm St
- 1007 N Wolfe St
- 1005 N Wolfe St
- 1024 N Blaine St
- 1414 E Russey St
- 1424 E Russey St
- 1016 N Blaine St
- 1003 N Wolfe St
- 1410 E Russey St
- 1020 N Wolfe St
- 1408 E Russey St
- 1012 N Blaine St
- 1014 N Wolfe St
- 1500 E Russey St
- 1400 E Russey St
- 1510 E Russey St
- 1421 E Highland Ave
- 1415 E Highland Ave
- 1103 N Blaine St
- 925 N Wolfe St
- 1015 N Brady St
Your Personal Tour Guide
Ask me questions while you tour the home.