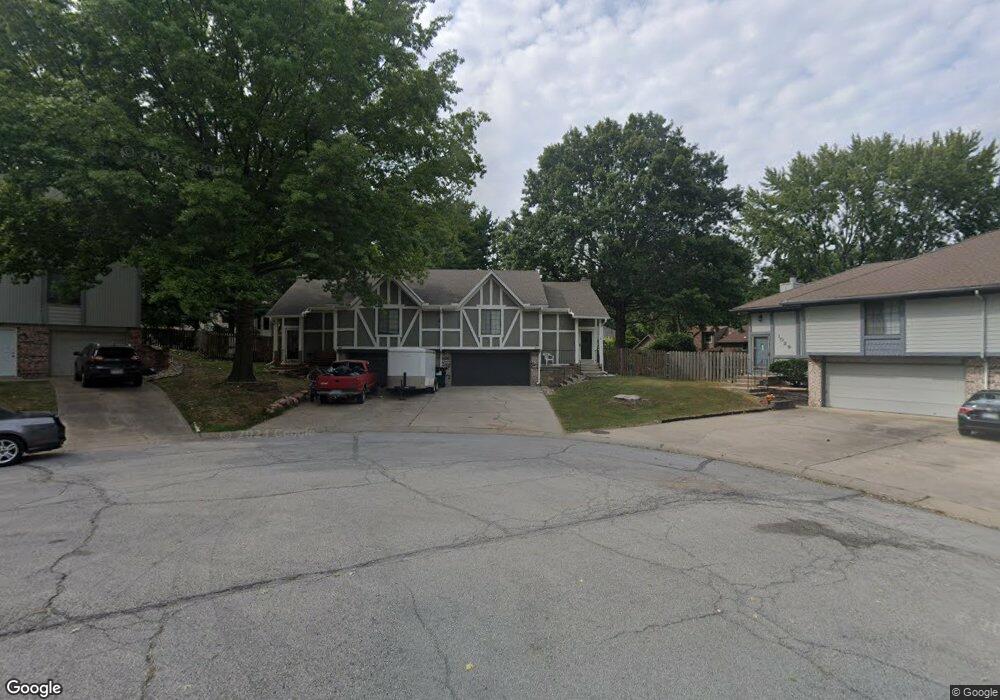
1025 NE 2nd St Blue Springs, MO 64014
Estimated Value: $313,000 - $390,000
4
Beds
4
Baths
2,036
Sq Ft
$180/Sq Ft
Est. Value
About This Home
This home is located at 1025 NE 2nd St, Blue Springs, MO 64014 and is currently estimated at $366,425, approximately $179 per square foot. 1025 NE 2nd St is a home located in Jackson County with nearby schools including James Walker Elementary School, Brittany Hill Middle School, and Blue Springs High School.
Ownership History
Date
Name
Owned For
Owner Type
Purchase Details
Closed on
Jun 16, 2010
Sold by
Thorley Trevor
Bought by
Thorley Barbara Roxann
Current Estimated Value
Purchase Details
Closed on
Jun 23, 2006
Sold by
Jacobs Greg L and Jacobs Dona M
Bought by
Thorley Trevor and Thorley Roxann
Home Financials for this Owner
Home Financials are based on the most recent Mortgage that was taken out on this home.
Original Mortgage
$143,200
Outstanding Balance
$84,472
Interest Rate
6.63%
Mortgage Type
Purchase Money Mortgage
Estimated Equity
$281,953
Purchase Details
Closed on
Jul 30, 1997
Sold by
Clifton Betty M and Clifton Haston E
Bought by
Jacobs Greg L and Jacobs Dona M
Home Financials for this Owner
Home Financials are based on the most recent Mortgage that was taken out on this home.
Original Mortgage
$121,500
Interest Rate
7.6%
Mortgage Type
Purchase Money Mortgage
Purchase Details
Closed on
Aug 8, 1996
Sold by
Haney Joseph H and Haney Donna M
Bought by
Clifton Betty M and Haston James E
Create a Home Valuation Report for This Property
The Home Valuation Report is an in-depth analysis detailing your home's value as well as a comparison with similar homes in the area
Home Values in the Area
Average Home Value in this Area
Purchase History
| Date | Buyer | Sale Price | Title Company |
|---|---|---|---|
| Thorley Barbara Roxann | -- | None Available | |
| Thorley Trevor | -- | Heart Of America Title & Esc | |
| Jacobs Greg L | -- | Stewart Title | |
| Clifton Betty M | -- | Stewart Title |
Source: Public Records
Mortgage History
| Date | Status | Borrower | Loan Amount |
|---|---|---|---|
| Open | Thorley Trevor | $143,200 | |
| Previous Owner | Jacobs Greg L | $121,500 |
Source: Public Records
Tax History Compared to Growth
Tax History
| Year | Tax Paid | Tax Assessment Tax Assessment Total Assessment is a certain percentage of the fair market value that is determined by local assessors to be the total taxable value of land and additions on the property. | Land | Improvement |
|---|---|---|---|---|
| 2025 | $3,336 | $47,023 | $10,627 | $36,396 |
| 2024 | $3,272 | $40,890 | $13,180 | $27,710 |
| 2023 | $3,272 | $40,890 | $4,999 | $35,891 |
| 2022 | $3,733 | $41,230 | $19,019 | $22,211 |
| 2021 | $3,729 | $41,230 | $19,019 | $22,211 |
| 2020 | $3,210 | $36,100 | $19,019 | $17,081 |
| 2019 | $3,104 | $51,189 | $19,019 | $32,170 |
| 2018 | $3,104 | $34,747 | $3,726 | $31,021 |
| 2017 | $3,104 | $34,747 | $3,726 | $31,021 |
| 2016 | $3,018 | $33,877 | $3,477 | $30,400 |
| 2014 | $2,719 | $30,422 | $3,477 | $26,945 |
Source: Public Records
Map
Nearby Homes
- 1200 NE Hilltop Dr
- 1200 NE Crestview Dr
- 0 NW Jefferson St
- 458 NE Coronado Dr
- 409 NW Locust Dr
- 204 NW Golfview Dr
- 705 NE Locust Dr
- 420 NE Golfview Dr
- 678 NW Valleybrook Rd
- 723 NW 6th Street Terrace
- 311 NE Bridge Place
- 1912 NW Manor Dr
- 1136 NE 10th St
- 280 NW Beau Dr
- 200 NE Knox St
- 300 NE Knox St
- 404 NE Lee Dr
- 804 NW Maynard St
- 1001 NE Wien Ave
- 517 NE Johnston Dr
- 1029 NE 2nd St
- 1108 NE 1st Street Terrace
- 1017 NE 2nd St
- 108 NE Locust Dr
- 112 NE Locust Dr
- 1104 NE 1st Street Terrace
- 1008 NE 2nd St
- 1117 NE 1st Street Terrace
- 1000 NE 2nd St
- 1009 NE 2nd St
- 116 NE Locust Dr
- 1100 NE 1st Street Terrace
- 104 NW Locust Dr
- 1100 SW Clark Road Bedroom 2a
- 120 NE Locust Dr
- 112 NW Locust Dr
- 209 NE Cedar Ct
- 204 NE Cedar Ct
- 1113 NE 1st Street Terrace
- 1113 NE 1st Street Terrace