Estimated Value: $183,000 - $201,000
4
Beds
3
Baths
1,619
Sq Ft
$117/Sq Ft
Est. Value
About This Home
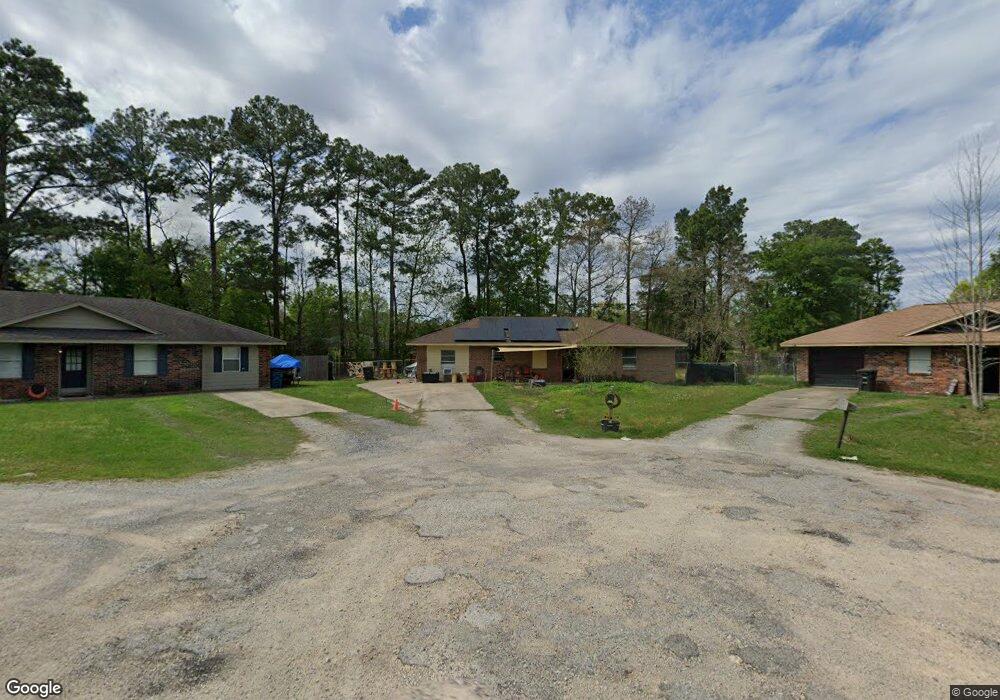
This home is located at 1025 Pine Cove St Unit 1025 Pinecove, Vidor, TX 77662 and is currently estimated at $189,178, approximately $116 per square foot. 1025 Pine Cove St Unit 1025 Pinecove is a home located in Orange County with nearby schools including Faith Christian Academy.
Ownership History
Date
Name
Owned For
Owner Type
Purchase Details
Closed on
Aug 20, 2021
Sold by
Mollys Holdings Llc
Bought by
Griffin Garrett
Current Estimated Value
Home Financials for this Owner
Home Financials are based on the most recent Mortgage that was taken out on this home.
Original Mortgage
$148,335
Outstanding Balance
$134,882
Interest Rate
2.9%
Mortgage Type
VA
Estimated Equity
$54,296
Purchase Details
Closed on
Jan 29, 2016
Sold by
United States Of America Rural Housing Servic
Bought by
Molly'S Holdings Llc
Purchase Details
Closed on
Jun 18, 2013
Sold by
Payne Dusti
Bought by
Molly'S Holdings Llc
Purchase Details
Closed on
Jun 4, 2013
Sold by
Carpenter Marie L
Bought by
United States Of America
Purchase Details
Closed on
Aug 2, 2005
Sold by
Cox William and Cox Charles
Bought by
Payne Dusti
Home Financials for this Owner
Home Financials are based on the most recent Mortgage that was taken out on this home.
Original Mortgage
$32,850
Interest Rate
5.55%
Mortgage Type
Purchase Money Mortgage
Create a Home Valuation Report for This Property
The Home Valuation Report is an in-depth analysis detailing your home's value as well as a comparison with similar homes in the area
Home Values in the Area
Average Home Value in this Area
Purchase History
| Date | Buyer | Sale Price | Title Company |
|---|---|---|---|
| Griffin Garrett | -- | Superior Title | |
| Molly'S Holdings Llc | -- | -- | |
| Molly'S Holdings Llc | -- | -- | |
| United States Of America | $52,791 | None Available | |
| Payne Dusti | -- | None Available | |
| Molly'S Holdings Llc | -- | -- |
Source: Public Records
Mortgage History
| Date | Status | Borrower | Loan Amount |
|---|---|---|---|
| Open | Griffin Garrett | $148,335 | |
| Previous Owner | Molly'S Holdings Llc | $32,850 |
Source: Public Records
Tax History Compared to Growth
Tax History
| Year | Tax Paid | Tax Assessment Tax Assessment Total Assessment is a certain percentage of the fair market value that is determined by local assessors to be the total taxable value of land and additions on the property. | Land | Improvement |
|---|---|---|---|---|
| 2024 | $2,971 | $166,057 | $6,347 | $159,710 |
| 2023 | $2,755 | $149,281 | $6,347 | $142,934 |
| 2022 | $2,830 | $133,467 | $6,347 | $127,120 |
| 2021 | $2,782 | $121,907 | $6,347 | $115,560 |
| 2020 | $2,534 | $108,597 | $6,347 | $102,250 |
| 2019 | $2,400 | $102,427 | $6,347 | $96,080 |
| 2018 | $2,221 | $97,847 | $6,347 | $91,500 |
| 2017 | $2,290 | $97,847 | $6,347 | $91,500 |
| 2016 | $2,112 | $91,917 | $6,347 | $85,570 |
| 2015 | $2,103 | $87,007 | $6,347 | $80,660 |
| 2014 | $2,103 | $87,782 | $6,347 | $81,435 |
Source: Public Records
Map
Nearby Homes
- 125 Needles St
- 545 Ruby St
- 105 Butler Rd
- 395 Needles St
- 430 Needles St
- 276 Pineburr St
- 276 Pine Burr St
- 850 Orange St
- 515 Needles St
- 860 Reynolds Ln
- 820 Reynolds Ln
- 0 Laurel St
- 0000 Laurel St
- 230 Sargent St
- 340 Welborn St
- 170 S Denver St
- 490 Concord St Unit 485 Lexington
- 1635 Blue Bonnet St
- 175 Connell Rd
- 785 E Bolivar St
- 1025 Pine Cove St
- 1035 Pine Cove St
- 1020 Pine Cove St
- 155 Needles St
- 145 Needles St
- 1045 Pine Cove St
- 1030 Pine Cove St
- 157 Needles St
- 1055 Pine Cove St
- 1050 Orange St
- 1050 Pine Cove St
- 1065 Pine Cove St
- 1070 Orange St
- 1025 Kent St
- 1035 Kent St
- 295 Needles St
- 1060 Pine Cove St
- 1045 Kent St
- 715 Orange St
- 702 Orange St