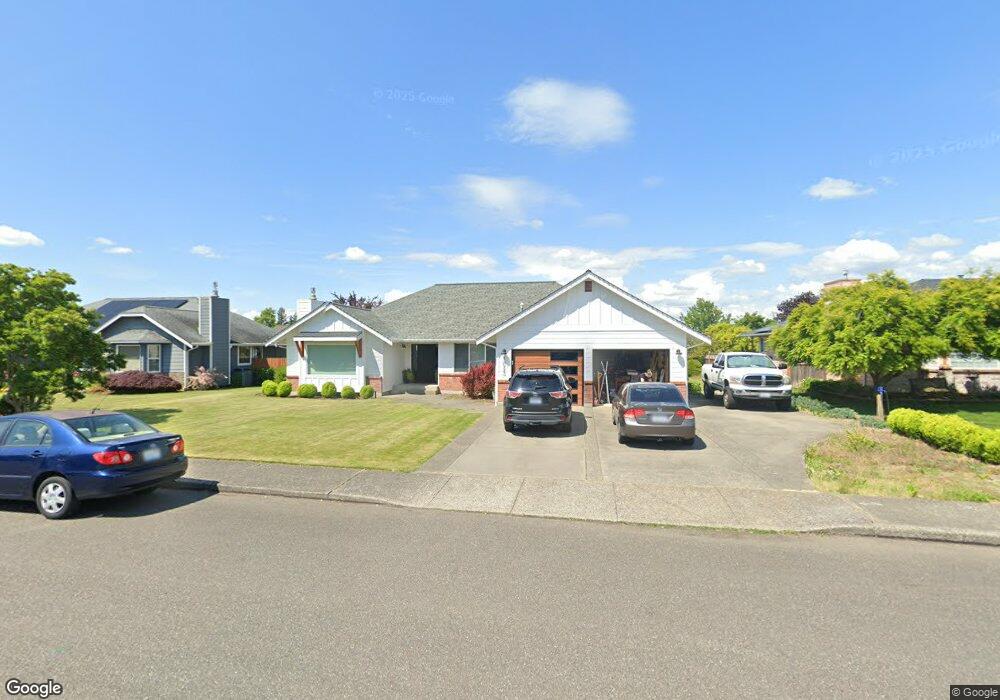
1025 Ridgeway Dr Lynden, WA 98264
Estimated Value: $625,000 - $672,000
4
Beds
2
Baths
2,086
Sq Ft
$313/Sq Ft
Est. Value
About This Home
This home is located at 1025 Ridgeway Dr, Lynden, WA 98264 and is currently estimated at $653,806, approximately $313 per square foot. 1025 Ridgeway Dr is a home located in Whatcom County with nearby schools including Lynden High School, Lynden Christian Schools: Administration, and Lynden Christian School.
Ownership History
Date
Name
Owned For
Owner Type
Purchase Details
Closed on
May 23, 2021
Sold by
Nelson Jordan B and Nelson Kate
Bought by
Jordan And Kate Nelson Living Trust
Current Estimated Value
Home Financials for this Owner
Home Financials are based on the most recent Mortgage that was taken out on this home.
Original Mortgage
$412,000
Interest Rate
2.98%
Mortgage Type
New Conventional
Purchase Details
Closed on
Dec 30, 2011
Sold by
Nelson Jordan B and Nelson Kate
Bought by
Nelson Jordan B and Nelson Kate
Purchase Details
Closed on
Jul 20, 2011
Sold by
Jennings William B and Jennings Jean A
Bought by
Nelson Jordan B and Nelson Kate
Home Financials for this Owner
Home Financials are based on the most recent Mortgage that was taken out on this home.
Original Mortgage
$257,940
Interest Rate
3.25%
Mortgage Type
New Conventional
Create a Home Valuation Report for This Property
The Home Valuation Report is an in-depth analysis detailing your home's value as well as a comparison with similar homes in the area
Home Values in the Area
Average Home Value in this Area
Purchase History
| Date | Buyer | Sale Price | Title Company |
|---|---|---|---|
| Jordan And Kate Nelson Living Trust | $313 | Bell Michael P | |
| Nelson Jordan B | $313 | Bell Michael P | |
| Nelson Jordan B | -- | Amrock Llc | |
| Nelson Jordan B | -- | Amrock Llc | |
| Nelson Jordan B | -- | None Available | |
| Nelson Jordan B | $286,880 | Chicago Title Insurance |
Source: Public Records
Mortgage History
| Date | Status | Borrower | Loan Amount |
|---|---|---|---|
| Previous Owner | Nelson Jordan B | $412,000 | |
| Previous Owner | Nelson Jordan B | $257,940 |
Source: Public Records
Tax History Compared to Growth
Tax History
| Year | Tax Paid | Tax Assessment Tax Assessment Total Assessment is a certain percentage of the fair market value that is determined by local assessors to be the total taxable value of land and additions on the property. | Land | Improvement |
|---|---|---|---|---|
| 2024 | $4,615 | $650,838 | $242,500 | $408,338 |
| 2023 | $4,615 | $642,633 | $250,000 | $392,633 |
| 2022 | $3,611 | $474,348 | $153,434 | $320,914 |
| 2021 | $3,542 | $392,018 | $126,803 | $265,215 |
| 2020 | $3,103 | $350,026 | $113,220 | $236,806 |
| 2019 | $2,760 | $321,027 | $103,955 | $217,072 |
| 2018 | $3,017 | $292,766 | $94,699 | $198,067 |
| 2017 | $2,890 | $262,782 | $85,000 | $177,782 |
| 2016 | $2,730 | $267,790 | $88,000 | $179,790 |
| 2015 | $2,420 | $251,605 | $84,640 | $166,965 |
| 2014 | -- | $243,079 | $81,760 | $161,319 |
| 2013 | -- | $241,319 | $80,000 | $161,319 |
Source: Public Records
Map
Nearby Homes
- 1251 Garden Cir
- 1112 N Cascade Ct
- 1136 N Cascade Ct
- 1178 E Grover St Unit 101
- 1095 Terrace Dr
- 8639 Bender Rd
- 9586 Bender Rd
- 924 E Grover St
- 1319 Bradley Ct
- 1660 Eastwood Way
- 1402 Bradley Meadows Ln
- 137 E Cedar Dr
- 107 Springview Dr
- 400 E Front St
- 114 Twin Sister Loop
- 2201 Dejong Dr
- 2205 Dejong Dr
- 1792 Bradley Rd
- 1077 Hampton Rd
- 301 S Park St
- 1013 Ridgeway Dr
- 1037 Ridgeway Dr
- 1024 Cascade Way
- 1012 Cascade Way
- 1049 Ridgeway Dr
- 1001 Ridgeway Dr
- 1100 Cascade Way
- 1000 Cascade Way
- 1024 Ridgeway Dr
- 1012 Ridgeway Dr
- 1134 Ridgeway Dr
- 1036 Ridgeway Dr
- 1112 Cascade Way
- 1000 Ridgeway Dr
- 1061 Ridgeway Dr
- 1048 Ridgeway Dr
- 1013 Cascade Way
- 1124 Cascade Way
- 1241 Garden Cir
- 1060 Ridgeway Dr