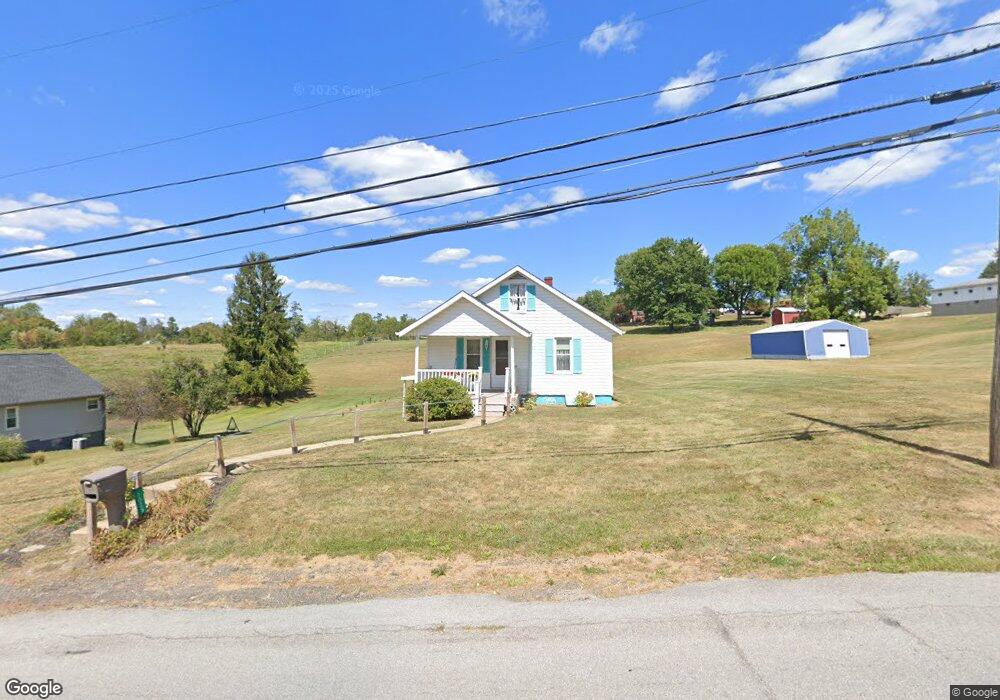
1025 Shamrock Dr Barnesville, OH 43713
Estimated Value: $110,060 - $173,000
2
Beds
1
Bath
836
Sq Ft
$170/Sq Ft
Est. Value
About This Home
This home is located at 1025 Shamrock Dr, Barnesville, OH 43713 and is currently estimated at $142,515, approximately $170 per square foot. 1025 Shamrock Dr is a home located in Belmont County with nearby schools including Barnesville Elementary School, Barnesville Middle School, and Barnesville High School.
Ownership History
Date
Name
Owned For
Owner Type
Purchase Details
Closed on
Oct 26, 2010
Sold by
Carpenter Barbara L
Bought by
Carpenter Bruce Patrick
Current Estimated Value
Purchase Details
Closed on
Jan 1, 1987
Sold by
Carpenter Barbara L and Carpenter Pat
Bought by
Carpenter Barbara L and Carpenter Patricke
Create a Home Valuation Report for This Property
The Home Valuation Report is an in-depth analysis detailing your home's value as well as a comparison with similar homes in the area
Home Values in the Area
Average Home Value in this Area
Purchase History
| Date | Buyer | Sale Price | Title Company |
|---|---|---|---|
| Carpenter Bruce Patrick | -- | Attorney | |
| Carpenter Barbara L | -- | -- |
Source: Public Records
Tax History Compared to Growth
Tax History
| Year | Tax Paid | Tax Assessment Tax Assessment Total Assessment is a certain percentage of the fair market value that is determined by local assessors to be the total taxable value of land and additions on the property. | Land | Improvement |
|---|---|---|---|---|
| 2024 | $530 | $26,150 | $5,090 | $21,060 |
| 2023 | $496 | $23,850 | $5,090 | $18,760 |
| 2022 | $510 | $23,848 | $5,092 | $18,756 |
| 2021 | $512 | $23,856 | $5,096 | $18,760 |
| 2020 | $395 | $19,910 | $4,250 | $15,660 |
| 2019 | $398 | $19,910 | $4,250 | $15,660 |
| 2018 | $347 | $19,910 | $4,250 | $15,660 |
| 2017 | $299 | $16,940 | $3,650 | $13,290 |
| 2016 | $283 | $16,940 | $3,650 | $13,290 |
| 2015 | $282 | $16,940 | $3,650 | $13,290 |
| 2014 | $267 | $16,340 | $3,310 | $13,030 |
| 2013 | $259 | $16,340 | $3,310 | $13,030 |
Source: Public Records
Map
Nearby Homes
- 0 Fairmont Ave Unit 5163784
- 0 Fairmont Ave Unit 5163774
- 185 Bethesda St
- 111 Pine Ln
- 166 Bethesda St
- 118 Pine Ln
- 144 Pine Ln
- 174 Pine Ln
- 613 E Main St
- 215 Railroad St
- 501 E Main St
- 143 Cherry St
- 136 E Walnut St
- 35659 Cr 122
- 62239 Hillcrest Rd
- 323 S Lincoln Ave
- 410 N Chestnut St
- 145 Kennard Ave
- 612 N Broadway St
- 618 Park St
- 1025 Shamrock Dr
- 61885 Sandy Ridge Rd
- 61885 Sandy Ridge Rd
- 1021 Shamrock Dr
- 0 Sandy Ridge Rd Unit T9514184
- 0 Sandy Ridge Rd Lot 2 Unit 3805778
- 0 Sandy Ridge Rd Lot 1 Unit 3805764
- 0 Sandy Ridge Rd Unit 4417926
- 61530 Roosevelt Rd
- 998 Shamrock Dr
- 61490 Roosevelt Rd
- 102 Roosevelt Rd
- 102 Roosevelt Rd
- 999 Shamrock Dr
- 61564 Roosevelt Rd
- 61819 Sandy Ridge Rd
- 61525 Roosevelt Rd
- 987 Shamrock Dr
- 61582 Roosevelt Rd
- 61561 Roosevelt Rd