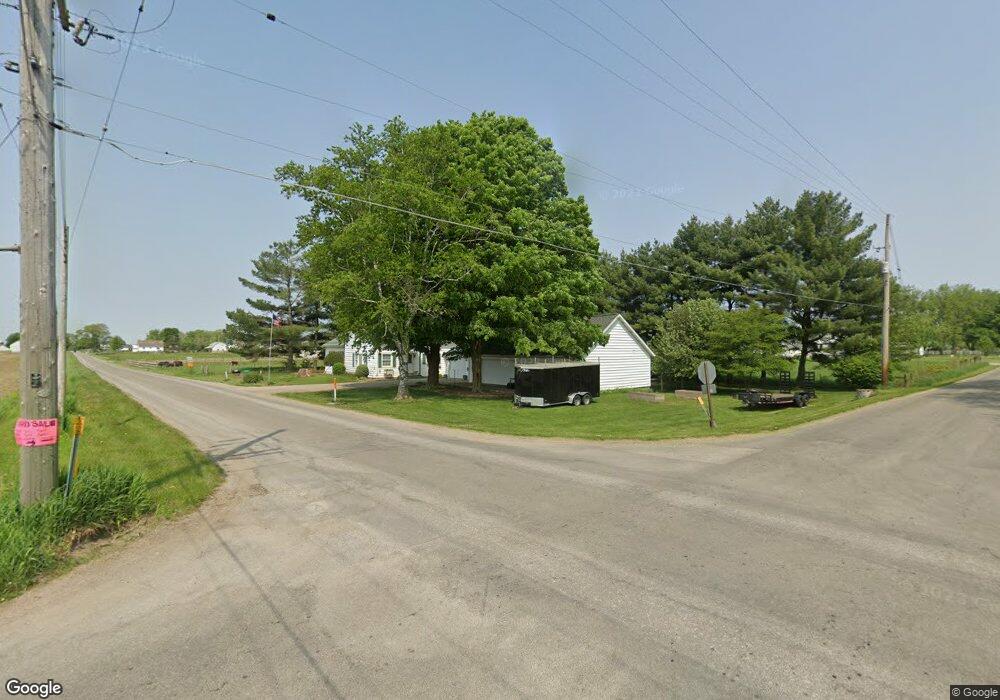
1025 W 050 N Lagrange, IN 46761
Estimated Value: $242,000 - $318,000
3
Beds
1
Bath
2,020
Sq Ft
$136/Sq Ft
Est. Value
About This Home
This home is located at 1025 W 050 N, Lagrange, IN 46761 and is currently estimated at $275,674, approximately $136 per square foot. 1025 W 050 N is a home located in LaGrange County with nearby schools including Lakeland Jr/Sr High School, Maple Grove School, and Pleasant Acres School.
Ownership History
Date
Name
Owned For
Owner Type
Purchase Details
Closed on
Jun 14, 2024
Sold by
Collyer Joshua and Collyer Brittany
Bought by
Bontrager Jordan and Bontrager Hannah
Current Estimated Value
Home Financials for this Owner
Home Financials are based on the most recent Mortgage that was taken out on this home.
Original Mortgage
$199,500
Outstanding Balance
$197,050
Interest Rate
7.22%
Mortgage Type
New Conventional
Estimated Equity
$78,624
Purchase Details
Closed on
Jun 26, 2018
Sold by
Lehman Michael J
Bought by
Collyer Joshua
Home Financials for this Owner
Home Financials are based on the most recent Mortgage that was taken out on this home.
Original Mortgage
$147,250
Interest Rate
4.6%
Mortgage Type
New Conventional
Purchase Details
Closed on
Jun 19, 2015
Sold by
Eric Ryan Hartman
Bought by
Michael J Lehman
Create a Home Valuation Report for This Property
The Home Valuation Report is an in-depth analysis detailing your home's value as well as a comparison with similar homes in the area
Home Values in the Area
Average Home Value in this Area
Purchase History
| Date | Buyer | Sale Price | Title Company |
|---|---|---|---|
| Bontrager Jordan | $210,000 | None Listed On Document | |
| Collyer Joshua | $184,062 | Superior Fin L Solutions | |
| Michael J Lehman | $118,000 | Lakeland Title Company |
Source: Public Records
Mortgage History
| Date | Status | Borrower | Loan Amount |
|---|---|---|---|
| Open | Bontrager Jordan | $199,500 | |
| Previous Owner | Collyer Joshua | $147,250 |
Source: Public Records
Tax History Compared to Growth
Tax History
| Year | Tax Paid | Tax Assessment Tax Assessment Total Assessment is a certain percentage of the fair market value that is determined by local assessors to be the total taxable value of land and additions on the property. | Land | Improvement |
|---|---|---|---|---|
| 2024 | $660 | $198,500 | $26,500 | $172,000 |
| 2023 | $659 | $188,400 | $26,300 | $162,100 |
| 2022 | $668 | $168,100 | $22,800 | $145,300 |
| 2021 | $528 | $143,200 | $20,800 | $122,400 |
| 2020 | $554 | $140,100 | $20,800 | $119,300 |
| 2019 | $542 | $139,900 | $23,200 | $116,700 |
| 2018 | $471 | $119,700 | $23,200 | $96,500 |
| 2017 | $471 | $120,000 | $20,400 | $99,600 |
| 2016 | $479 | $121,900 | $17,400 | $104,500 |
| 2014 | $317 | $94,600 | $17,400 | $77,200 |
| 2013 | $317 | $95,500 | $17,400 | $78,100 |
Source: Public Records
Map
Nearby Homes
- 415 W 060 N
- 0 Corner of Factory St & Townline Rd Unit 202541800
- 217 N Sherman St
- 915 N 015 E
- 914 S Detroit St
- 207 S Poplar St
- 1575 W 195 N
- 737 N Canal St
- 245 E 100 S
- 306 N 100 E
- 2930 N 080 E
- 1400 N 200 E
- 125 E Lot 10
- 3915 N 200 E
- 1030 N 400 E
- 5145 N 290 W
- 4370 N 230 E
- 1770 W 570 N
- 1895 W 570 N
- 1510 Indiana 120