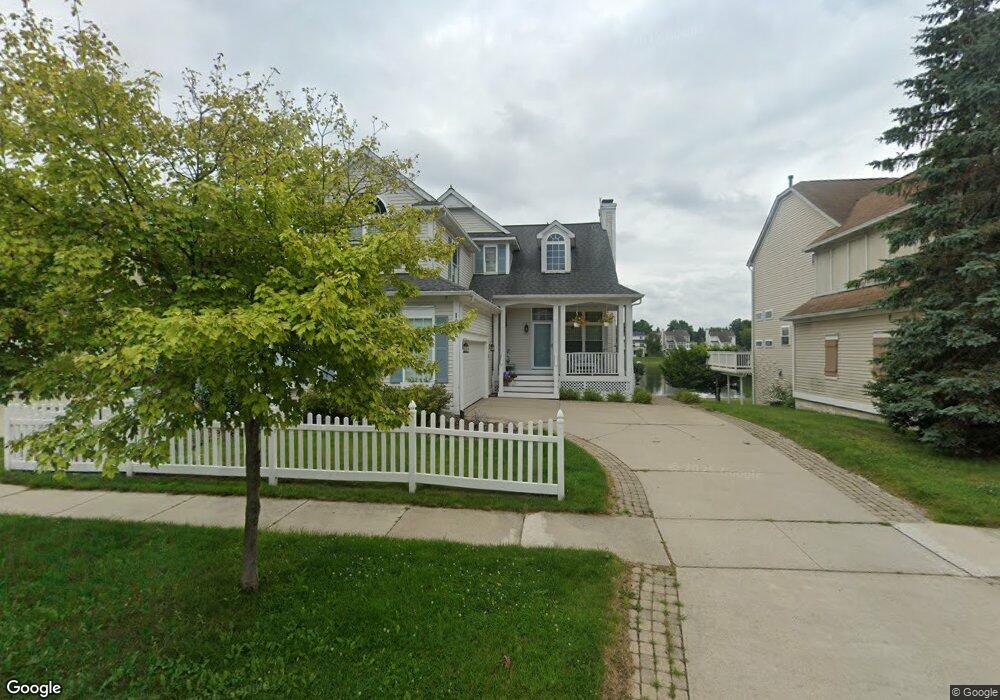
1025 Watersedge Ct Unit 146 Oxford, MI 48371
Estimated Value: $413,185 - $494,000
3
Beds
4
Baths
1,825
Sq Ft
$242/Sq Ft
Est. Value
About This Home
This home is located at 1025 Watersedge Ct Unit 146, Oxford, MI 48371 and is currently estimated at $441,796, approximately $242 per square foot. 1025 Watersedge Ct Unit 146 is a home located in Oakland County with nearby schools including Oxford Elementary School, Daniel Axford Elementary School, and Oxford Middle School.
Ownership History
Date
Name
Owned For
Owner Type
Purchase Details
Closed on
Sep 3, 2008
Sold by
Srbinovski Tom T and Srbinovski Anita
Bought by
Donaldson Barrett and Donaldson Lori
Current Estimated Value
Home Financials for this Owner
Home Financials are based on the most recent Mortgage that was taken out on this home.
Original Mortgage
$210,174
Outstanding Balance
$139,996
Interest Rate
6.55%
Mortgage Type
FHA
Estimated Equity
$301,800
Purchase Details
Closed on
May 22, 2003
Sold by
Srbinovski Tom T
Bought by
Srbinovski Tom T and Srbinovski Anita
Purchase Details
Closed on
Aug 16, 2002
Sold by
Delcor Homes Oxford I
Bought by
Srbinovski Tom T
Home Financials for this Owner
Home Financials are based on the most recent Mortgage that was taken out on this home.
Original Mortgage
$210,750
Interest Rate
6.4%
Create a Home Valuation Report for This Property
The Home Valuation Report is an in-depth analysis detailing your home's value as well as a comparison with similar homes in the area
Home Values in the Area
Average Home Value in this Area
Purchase History
| Date | Buyer | Sale Price | Title Company |
|---|---|---|---|
| Donaldson Barrett | $214,000 | Philip R Seaver Title Co Inc | |
| Srbinovski Tom T | -- | -- | |
| Srbinovski Tom T | $72,725 | -- |
Source: Public Records
Mortgage History
| Date | Status | Borrower | Loan Amount |
|---|---|---|---|
| Open | Donaldson Barrett | $210,174 | |
| Previous Owner | Srbinovski Tom T | $210,750 |
Source: Public Records
Tax History Compared to Growth
Tax History
| Year | Tax Paid | Tax Assessment Tax Assessment Total Assessment is a certain percentage of the fair market value that is determined by local assessors to be the total taxable value of land and additions on the property. | Land | Improvement |
|---|---|---|---|---|
| 2024 | $2,398 | $187,630 | $0 | $0 |
| 2023 | $2,287 | $159,610 | $0 | $0 |
| 2022 | $3,540 | $147,170 | $0 | $0 |
| 2021 | $3,384 | $139,930 | $0 | $0 |
| 2020 | $2,161 | $134,980 | $0 | $0 |
| 2019 | $3,158 | $127,800 | $0 | $0 |
| 2018 | $3,098 | $120,230 | $0 | $0 |
| 2017 | $2,976 | $119,790 | $0 | $0 |
| 2016 | $2,970 | $118,130 | $0 | $0 |
| 2015 | -- | $112,660 | $0 | $0 |
| 2014 | -- | $101,780 | $0 | $0 |
| 2011 | -- | $78,940 | $0 | $0 |
Source: Public Records
Map
Nearby Homes
- 1172 Fountain View Ln Unit 72
- 778 W Peninsula Ct
- 372 Overlook Dr
- 587 Eastlake Trail
- 254 Cross Timbers St
- 302 Tanview Dr
- 682 Westlake Ave
- 65 1st St
- 622 Westlake Ave
- 720 Marlayna Dr
- 35 West St
- 822 Westlake Ave
- 224 Stony Lake Dr Unit 57
- 68 N Washington St
- 23 W Burdick St
- 1611 Harwood Dr
- 994 Chelsea Blvd
- 227 Ora Rd
- 35 East St
- 1858 Sandy Shores Dr
- 1035 Watersedge Ct
- 1015 Watersedge Ct Unit 145
- 1045 Watersedge Ct Unit 148
- 1005 Watersedge Ct Unit 144
- 995 Watersedge Ct
- 1020 Watersedge Ct Unit 135
- 1030 Watersedge Ct Unit 134
- 1010 Watersedge Ct Unit 136
- 1055 Watersedge Ct Unit 149
- 1040 Watersedge Ct Unit 133
- 1000 Watersedge Ct Unit Bldg-Unit
- 1000 Watersedge Ct
- 985 Watersedge Ct
- 1065 Watersedge Ct Unit 150
- 1050 Watersedge Ct Unit 132
- 975 Watersedge Ct
- 1060 Watersedge Ct Unit 131
- 1075 Watersedge Ct Unit 151
- 1074 Watersedge Ct Unit 130
- 965 Watersedge Ct