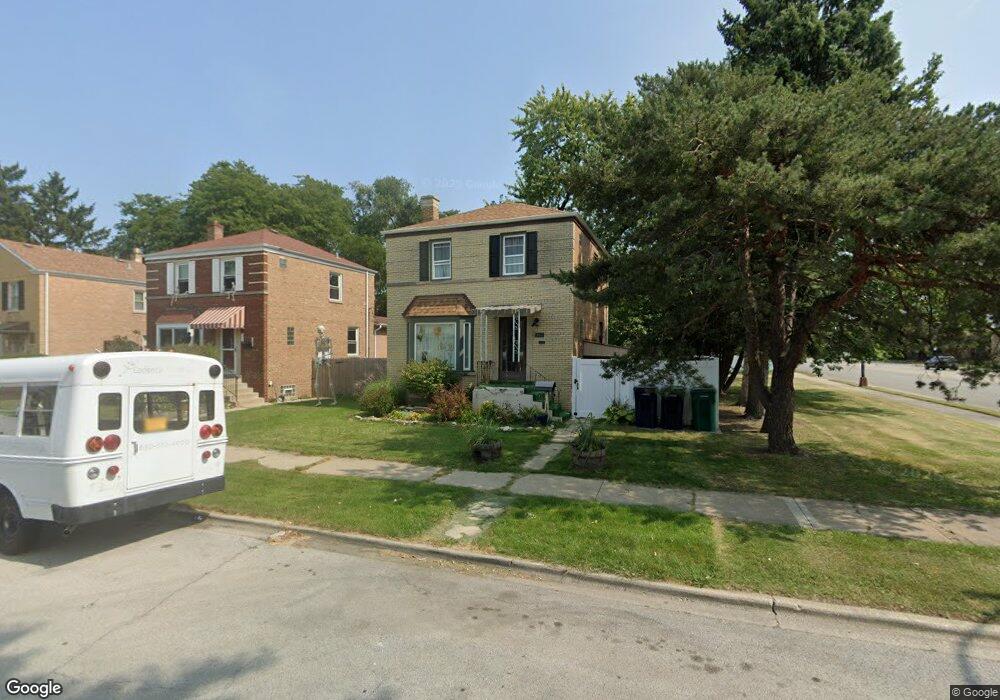
10251 S Turner Ave Evergreen Park, IL 60805
Estimated Value: $204,000 - $315,000
3
Beds
1
Bath
1,223
Sq Ft
$219/Sq Ft
Est. Value
About This Home
This home is located at 10251 S Turner Ave, Evergreen Park, IL 60805 and is currently estimated at $268,348, approximately $219 per square foot. 10251 S Turner Ave is a home located in Cook County with nearby schools including Southwest Elementary School, Central Jr High School, and Evergreen Park High School.
Ownership History
Date
Name
Owned For
Owner Type
Purchase Details
Closed on
Jul 6, 2018
Sold by
Castner Donna J
Bought by
Turczak Daniel C
Current Estimated Value
Home Financials for this Owner
Home Financials are based on the most recent Mortgage that was taken out on this home.
Original Mortgage
$130,150
Outstanding Balance
$113,093
Interest Rate
4.62%
Mortgage Type
New Conventional
Estimated Equity
$155,255
Purchase Details
Closed on
Dec 4, 1996
Sold by
Standard Bank & Trust Company
Bought by
Castner Donna J
Home Financials for this Owner
Home Financials are based on the most recent Mortgage that was taken out on this home.
Original Mortgage
$65,700
Interest Rate
7.85%
Purchase Details
Closed on
Feb 1, 1995
Sold by
Castner Ronald A and Castner Donna J
Bought by
Standard Bank & Trust Company
Create a Home Valuation Report for This Property
The Home Valuation Report is an in-depth analysis detailing your home's value as well as a comparison with similar homes in the area
Home Values in the Area
Average Home Value in this Area
Purchase History
| Date | Buyer | Sale Price | Title Company |
|---|---|---|---|
| Turczak Daniel C | $137,000 | Attorney | |
| Castner Donna J | -- | -- | |
| Standard Bank & Trust Company | -- | -- |
Source: Public Records
Mortgage History
| Date | Status | Borrower | Loan Amount |
|---|---|---|---|
| Open | Turczak Daniel C | $130,150 | |
| Previous Owner | Castner Donna J | $65,700 |
Source: Public Records
Tax History Compared to Growth
Tax History
| Year | Tax Paid | Tax Assessment Tax Assessment Total Assessment is a certain percentage of the fair market value that is determined by local assessors to be the total taxable value of land and additions on the property. | Land | Improvement |
|---|---|---|---|---|
| 2024 | $7,167 | $21,000 | $3,557 | $17,443 |
| 2023 | $5,961 | $21,000 | $3,557 | $17,443 |
| 2022 | $5,961 | $15,062 | $3,049 | $12,013 |
| 2021 | $5,758 | $15,062 | $3,049 | $12,013 |
| 2020 | $5,544 | $15,062 | $3,049 | $12,013 |
| 2019 | $6,767 | $17,426 | $2,795 | $14,631 |
| 2018 | $6,632 | $17,426 | $2,795 | $14,631 |
| 2017 | $6,928 | $18,510 | $2,795 | $15,715 |
| 2016 | $6,266 | $15,827 | $2,286 | $13,541 |
| 2015 | $6,279 | $15,827 | $2,286 | $13,541 |
| 2014 | $6,127 | $15,827 | $2,286 | $13,541 |
| 2013 | $6,911 | $19,348 | $2,286 | $17,062 |
Source: Public Records
Map
Nearby Homes
- 10455 S Spaulding Ave
- 3534 W 103rd St
- 10026 S Spaulding Ave
- 10240 S Whipple St
- 3435 W 105th Place
- 9953 S Sawyer Ave
- 10324 S Sacramento Ave
- 10416 S Sacramento Ave
- 10615 S Trumbull Ave
- 10533 S Whipple St
- 10649 S Sawyer Ave
- 3428 W 107th St
- 10639 S Whipple St
- 10511 S Hamlin Ave
- The Cherry Plan at Steeple Bend
- The Birch Plan at Steeple Bend
- The Ash Plan at Steeple Bend
- The Dogwood Plan at Steeple Bend
- 3249 W 108th St
- 2918 W 99th Place
- 10251 S Turner Ave
- 10251 S Turner Ave
- 10247 S Turner Ave
- 10247 S Turner Ave
- 10301 S Christiana Ave
- 10243 S Turner Ave
- 10243 S Turner Ave
- 10254 S Spaulding Ave
- 10248 S Spaulding Ave
- 10309 S Christiana Ave
- 10300 S Spaulding Ave
- 10239 S Turner Ave
- 10239 S Turner Ave
- 10236 S Spaulding Ave
- 10254 S Turner Ave
- 10311 S Christiana Ave
- 10250 S Turner Ave
- 10234 S Spaulding Ave
- 10234 S Spaulding Ave
- 10304 S Spaulding Ave