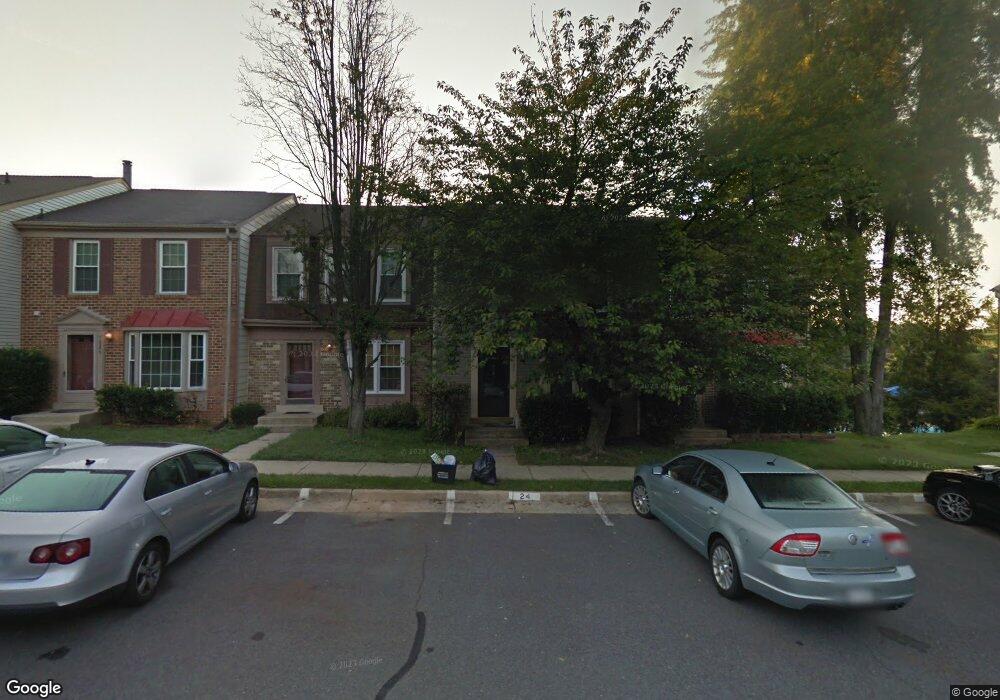
10254 Colony Park Dr Fairfax, VA 22032
Estimated Value: $578,000 - $624,000
3
Beds
4
Baths
1,614
Sq Ft
$373/Sq Ft
Est. Value
About This Home
This home is located at 10254 Colony Park Dr, Fairfax, VA 22032 and is currently estimated at $602,544, approximately $373 per square foot. 10254 Colony Park Dr is a home located in Fairfax County with nearby schools including Bonnie Brae Elementary School, James W Robinson, Jr. Secondary School, and Fairfax Baptist Temple Academy.
Ownership History
Date
Name
Owned For
Owner Type
Purchase Details
Closed on
Sep 30, 2009
Sold by
Esi Rukevbe
Bought by
Farazmand Shayan
Current Estimated Value
Home Financials for this Owner
Home Financials are based on the most recent Mortgage that was taken out on this home.
Original Mortgage
$326,922
Outstanding Balance
$212,174
Interest Rate
5.12%
Mortgage Type
FHA
Estimated Equity
$390,370
Purchase Details
Closed on
Nov 3, 2003
Sold by
Chadwick Susan E
Bought by
Esi Rukevbe A
Home Financials for this Owner
Home Financials are based on the most recent Mortgage that was taken out on this home.
Original Mortgage
$222,000
Interest Rate
6.05%
Mortgage Type
New Conventional
Purchase Details
Closed on
Sep 11, 2000
Sold by
Broadwell David W
Bought by
Kunstel Kyle and Chadwick,Susan E
Home Financials for this Owner
Home Financials are based on the most recent Mortgage that was taken out on this home.
Original Mortgage
$156,750
Interest Rate
8.1%
Create a Home Valuation Report for This Property
The Home Valuation Report is an in-depth analysis detailing your home's value as well as a comparison with similar homes in the area
Home Values in the Area
Average Home Value in this Area
Purchase History
| Date | Buyer | Sale Price | Title Company |
|---|---|---|---|
| Farazmand Shayan | $339,000 | -- | |
| Esi Rukevbe A | $277,500 | -- | |
| Kunstel Kyle | $165,000 | -- |
Source: Public Records
Mortgage History
| Date | Status | Borrower | Loan Amount |
|---|---|---|---|
| Open | Farazmand Shayan | $326,922 | |
| Previous Owner | Esi Rukevbe A | $222,000 | |
| Previous Owner | Kunstel Kyle | $156,750 |
Source: Public Records
Tax History Compared to Growth
Tax History
| Year | Tax Paid | Tax Assessment Tax Assessment Total Assessment is a certain percentage of the fair market value that is determined by local assessors to be the total taxable value of land and additions on the property. | Land | Improvement |
|---|---|---|---|---|
| 2025 | $5,935 | $566,810 | $185,000 | $381,810 |
| 2024 | $5,935 | $512,290 | $165,000 | $347,290 |
| 2023 | $5,618 | $497,850 | $160,000 | $337,850 |
| 2022 | $5,280 | $461,730 | $140,000 | $321,730 |
| 2021 | $5,262 | $448,360 | $135,000 | $313,360 |
| 2020 | $4,680 | $395,460 | $115,000 | $280,460 |
| 2019 | $4,657 | $393,490 | $115,000 | $278,490 |
| 2018 | $4,433 | $385,520 | $110,000 | $275,520 |
| 2017 | $4,259 | $366,800 | $100,000 | $266,800 |
| 2016 | $4,125 | $356,060 | $95,000 | $261,060 |
| 2015 | $3,876 | $347,280 | $90,000 | $257,280 |
| 2014 | $3,783 | $339,730 | $85,000 | $254,730 |
Source: Public Records
Map
Nearby Homes
- 5515 Cheshire Meadows Way
- 5453 Cheshire Meadows Way
- 5508 La Cross Ct
- 5431 Crows Nest Ct
- 10330 Luria Commons Ct Unit 1B
- 5504 Winford Ct
- 5811 Cove Landing Rd Unit 301
- 10434 Calumet Grove Dr
- 5809 Wood Poppy Ct
- 10388 Hampshire Green Ave
- 5806 Cove Landing Rd Unit 304
- 10449 Calumet Grove Dr
- 10412 Pearl St
- 12210 Wye Oak Commons Cir
- 5377 Laura Belle Ln
- 5976 Annaberg Place Unit 168
- 5837 Cove Landing Rd Unit 101
- 5932 Cove Landing Rd Unit 101
- 10402 Hollyoak Place
- 5918 Cove Landing Rd Unit 204
- 10256 Colony Park Dr
- 10252 Colony Park Dr
- 10258 Colony Park Dr
- 10250 Colony Park Dr
- 10260 Colony Park Dr
- 10262 Colony Park Dr
- 10239 Colony Park Dr
- 10241 Colony Park Dr
- 10243 Colony Park Dr
- 10250 New Guinea Rd
- 10245 Colony Park Dr
- 10255 Colony Park Dr
- 10253 Colony Park Dr Unit 150
- 10257 Colony Park Dr
- 10247 Colony Park Dr
- 10264 Colony Park Dr
- 10251 Colony Park Dr
- 10259 Colony Park Dr
- 10266 Colony Park Dr
- 10249 Colony Park Dr