Estimated Value: $169,669 - $242,000
--
Bed
2
Baths
720
Sq Ft
$264/Sq Ft
Est. Value
About This Home
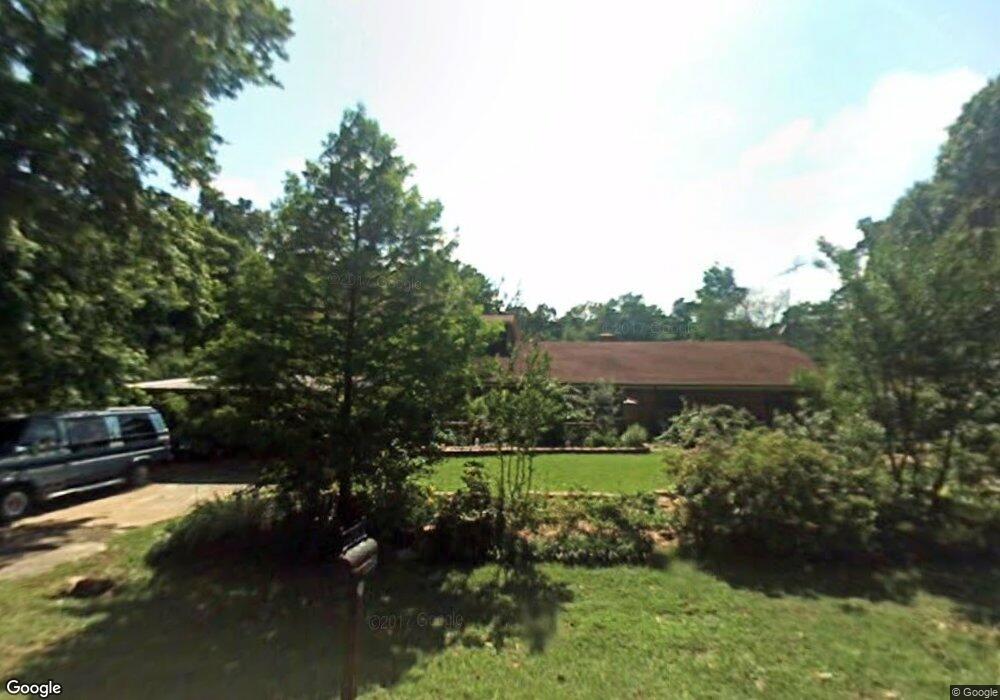
This home is located at 10254 Crestview Dr, Tyler, TX 75707 and is currently estimated at $190,167, approximately $264 per square foot. 10254 Crestview Dr is a home located in Smith County with nearby schools including Kissam Intermediate School, Jackson Elementary School, and Chapel Hill Middle School.
Create a Home Valuation Report for This Property
The Home Valuation Report is an in-depth analysis detailing your home's value as well as a comparison with similar homes in the area
Home Values in the Area
Average Home Value in this Area
Tax History Compared to Growth
Tax History
| Year | Tax Paid | Tax Assessment Tax Assessment Total Assessment is a certain percentage of the fair market value that is determined by local assessors to be the total taxable value of land and additions on the property. | Land | Improvement |
|---|---|---|---|---|
| 2025 | $460 | $126,485 | $25,911 | $100,574 |
| 2024 | $460 | $152,703 | $33,750 | $118,953 |
| 2023 | $3,271 | $217,181 | $33,750 | $183,431 |
| 2022 | $2,784 | $186,519 | $15,000 | $171,519 |
| 2021 | $2,697 | $158,279 | $15,000 | $143,279 |
| 2020 | $2,788 | $157,011 | $15,000 | $142,011 |
| 2019 | $148 | $151,335 | $15,000 | $136,335 |
| 2018 | $2,573 | $139,473 | $15,000 | $124,473 |
| 2017 | $2,737 | $147,570 | $15,000 | $132,570 |
| 2016 | $2,596 | $139,957 | $15,000 | $124,957 |
| 2015 | $1,590 | $137,452 | $15,000 | $122,452 |
| 2014 | $1,590 | $135,810 | $15,000 | $120,810 |
Source: Public Records
Map
Nearby Homes
- 9961 Creek Bend Dr
- 10680 County Road 214
- 7789 Lakeshore Dr
- 10789 County Road 214
- 13310 White Tail Dr
- 13332 White Tail Dr
- 13311 White Tail Dr
- 13311 White Tail Dr Unit 1
- 11452 County Road 2326
- 13807 County Road 220
- 13800 County Road 220
- 13594 State Highway 64 E
- 10788 County Road 225
- 00 County Road 2209
- 10908 & 10914 County Road 225
- 14951 County Road 2205
- 8217 County Road 219
- 8226 County Road 219
- 0000 State Highway 64
- 10114 County Road 272
- 10236 Crestview Dr
- 10284 Crestview Dr
- 10257 Crestview Dr
- 10238 Rolling Pines Dr
- 10235 Crestview Dr
- 10220 Rolling Pines Dr
- 10217 Crestview Dr
- 10301 Crestview Dr
- 10202 Crestview Dr
- 10204 Rolling Pines Dr
- 10330 Crestview Dr
- 10237 Rolling Pines Dr
- 10203 Crestview Dr
- 10221 Rolling Pines Dr
- 10160 Brookwood Dr
- 10201 Rolling Pines Dr
- 10299 Creek Bend Dr
- 10339 Crestview Dr
- 10187 Crestview Dr
- 10142 Brookwood Dr