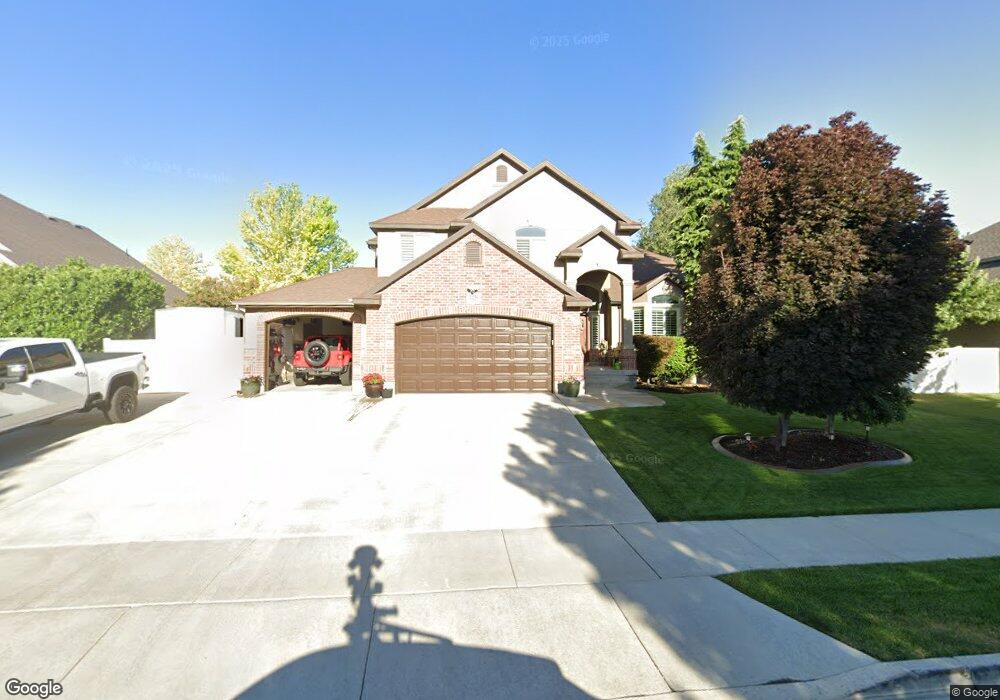
10256 S Chestnut View Ct South Jordan, UT 84095
Oquirrh Park NeighborhoodEstimated Value: $797,000 - $935,000
7
Beds
4
Baths
4,050
Sq Ft
$212/Sq Ft
Est. Value
About This Home
This home is located at 10256 S Chestnut View Ct, South Jordan, UT 84095 and is currently estimated at $859,343, approximately $212 per square foot. 10256 S Chestnut View Ct is a home located in Salt Lake County with nearby schools including Welby Elementary School, Elk Ridge Middle School, and Mountain West Montessori Academy.
Ownership History
Date
Name
Owned For
Owner Type
Purchase Details
Closed on
Sep 30, 2024
Sold by
Rico Robbie L and Rico Katherine F
Bought by
Robbie L Rico & Katherine F Rico Living Trust and Rico
Current Estimated Value
Purchase Details
Closed on
Mar 11, 2020
Sold by
Rico Rob L and Rico Katherine F
Bought by
Rico Robbie L and Rico Katherine F
Home Financials for this Owner
Home Financials are based on the most recent Mortgage that was taken out on this home.
Original Mortgage
$274,860
Interest Rate
3.5%
Mortgage Type
New Conventional
Purchase Details
Closed on
Jan 7, 2011
Sold by
Buckway Cory Michael and Buckway Ranae C
Bought by
Rico Rob L and Rico Katherine F
Purchase Details
Closed on
Mar 9, 2006
Sold by
Perry Homes Utah Inc
Bought by
Buckway Cory Michael and Buckway Ranae C
Home Financials for this Owner
Home Financials are based on the most recent Mortgage that was taken out on this home.
Original Mortgage
$280,640
Interest Rate
6.08%
Mortgage Type
Unknown
Create a Home Valuation Report for This Property
The Home Valuation Report is an in-depth analysis detailing your home's value as well as a comparison with similar homes in the area
Home Values in the Area
Average Home Value in this Area
Purchase History
| Date | Buyer | Sale Price | Title Company |
|---|---|---|---|
| Robbie L Rico & Katherine F Rico Living Trust | -- | None Listed On Document | |
| Rico Robbie L | -- | Titleone | |
| Rico Rob L | -- | Integrated Title Ins Svcs | |
| Buckway Cory Michael | -- | Meridian Title | |
| Perry Homes Utah Inc | -- | Meridian Title |
Source: Public Records
Mortgage History
| Date | Status | Borrower | Loan Amount |
|---|---|---|---|
| Previous Owner | Rico Robbie L | $274,860 | |
| Previous Owner | Buckway Cory Michael | $280,640 |
Source: Public Records
Tax History Compared to Growth
Tax History
| Year | Tax Paid | Tax Assessment Tax Assessment Total Assessment is a certain percentage of the fair market value that is determined by local assessors to be the total taxable value of land and additions on the property. | Land | Improvement |
|---|---|---|---|---|
| 2025 | $4,081 | $832,900 | $188,600 | $644,300 |
| 2024 | $4,081 | $774,800 | $175,000 | $599,800 |
| 2023 | $4,169 | $746,900 | $170,000 | $576,900 |
| 2022 | $4,348 | $763,400 | $166,700 | $596,700 |
| 2021 | $3,593 | $578,800 | $127,300 | $451,500 |
| 2020 | $3,496 | $527,900 | $123,200 | $404,700 |
| 2019 | $3,420 | $507,700 | $123,200 | $384,500 |
| 2018 | $3,229 | $476,900 | $123,200 | $353,700 |
| 2017 | $3,130 | $453,000 | $100,800 | $352,200 |
| 2016 | $3,239 | $444,300 | $100,800 | $343,500 |
| 2015 | $3,086 | $411,600 | $102,700 | $308,900 |
| 2014 | $2,870 | $376,100 | $95,000 | $281,100 |
Source: Public Records
Map
Nearby Homes
- 4208 W Chestnut View Dr
- 4246 W Ascot Downs Dr
- 10426 S Millerton Dr
- 4072 W Ascot Downs Dr
- 4058 W Ascot Downs Dr
- 4271 W Clarks Hill Dr
- 10376 S 3970 W
- 4091 W Juniper Hills Dr
- 3928 W Kilt St
- 4438 W South Jordan Pkwy
- 10459 S Sage Wood Way
- 10448 S Sage Vista Way
- 10674 Pine Shadow Rd
- 10674 S Pine Shadow Rd
- 11789 4000 W
- 4523 W South Jordan Pkwy
- 10447 S Garden Sage Cir
- 10164 Birnam Woods Way
- 10663 Vermillion Dr W
- 4618 W Chenango Ln
- 10256 Chestnut View Ct
- 10272 Chestnut View Ct
- 10238 Chestnut View Ct
- 4199 Chestnut View Dr
- 4213 W Chestnut View Dr
- 4213 Chestnut View Dr
- 10255 S Spruce Leaf Dr
- 10255 Spruce Leaf Dr
- 10269 S Spruce Leaf Dr
- 10269 Spruce Leaf Dr
- 10282 Chestnut View Ct
- 10253 Chestnut View Ct
- 10239 Chestnut View Ct
- 10267 Chestnut View Ct
- 4227 W Chestnut View Dr
- 10281 S Spruce Leaf Dr
- 10281 Spruce Leaf Dr
- 4227 Chestnut View Dr
- 10279 Chestnut View Ct
- 10292 S Chestnut View Ct