Estimated Value: $380,000 - $427,000
3
Beds
1
Bath
1,076
Sq Ft
$376/Sq Ft
Est. Value
About This Home
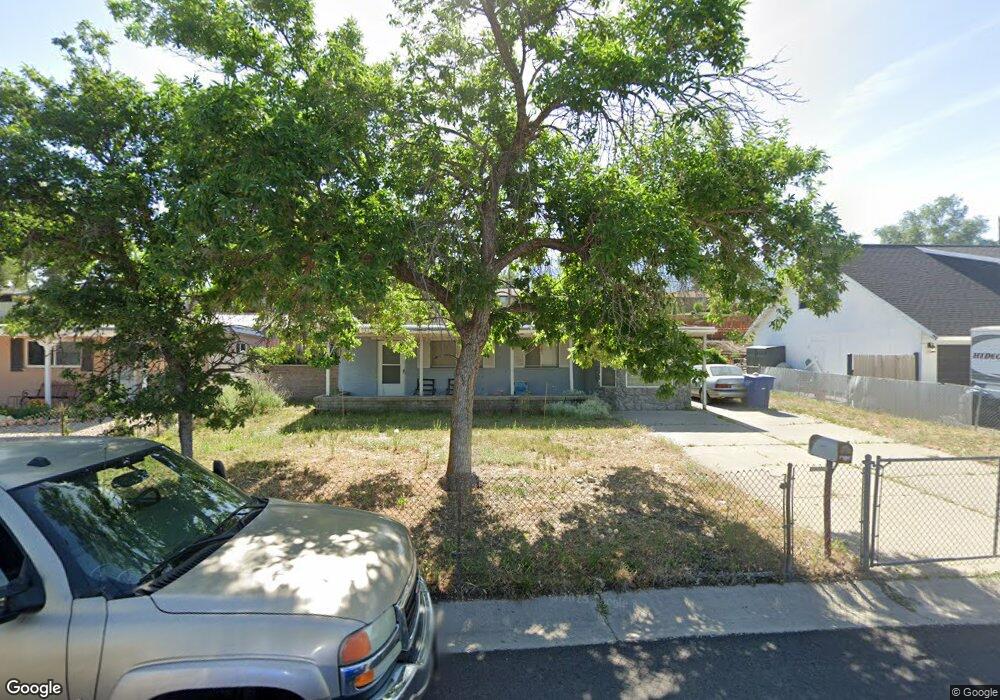
This home is located at 10257 Zinnia Way, Sandy, UT 84094 and is currently estimated at $404,804, approximately $376 per square foot. 10257 Zinnia Way is a home located in Salt Lake County with nearby schools including Alta View Elementary School, Jordan High, and Eastmont Middle School.
Ownership History
Date
Name
Owned For
Owner Type
Purchase Details
Closed on
Jan 16, 2001
Sold by
Hadley Steven and Hadley Peggy S
Bought by
Dimond Dezree D
Current Estimated Value
Home Financials for this Owner
Home Financials are based on the most recent Mortgage that was taken out on this home.
Original Mortgage
$52,780
Outstanding Balance
$19,474
Interest Rate
7.54%
Mortgage Type
FHA
Estimated Equity
$385,330
Purchase Details
Closed on
Dec 2, 1997
Sold by
Hadley Peggy S and Hadley Steven
Bought by
Hadley Steven and Hadley Peggy S
Home Financials for this Owner
Home Financials are based on the most recent Mortgage that was taken out on this home.
Original Mortgage
$97,200
Interest Rate
7.31%
Purchase Details
Closed on
Sep 8, 1995
Sold by
Patterson Peggy S
Bought by
Hadley Peggy S and Hadley Steven
Home Financials for this Owner
Home Financials are based on the most recent Mortgage that was taken out on this home.
Original Mortgage
$28,492
Interest Rate
7.4%
Create a Home Valuation Report for This Property
The Home Valuation Report is an in-depth analysis detailing your home's value as well as a comparison with similar homes in the area
Home Values in the Area
Average Home Value in this Area
Purchase History
| Date | Buyer | Sale Price | Title Company |
|---|---|---|---|
| Dimond Dezree D | -- | United Title Services | |
| Hadley Steven | -- | -- | |
| Hadley Peggy S | -- | -- |
Source: Public Records
Mortgage History
| Date | Status | Borrower | Loan Amount |
|---|---|---|---|
| Open | Dimond Dezree D | $52,780 | |
| Previous Owner | Hadley Steven | $97,200 | |
| Previous Owner | Hadley Peggy S | $28,492 |
Source: Public Records
Tax History Compared to Growth
Tax History
| Year | Tax Paid | Tax Assessment Tax Assessment Total Assessment is a certain percentage of the fair market value that is determined by local assessors to be the total taxable value of land and additions on the property. | Land | Improvement |
|---|---|---|---|---|
| 2025 | $1,878 | $298,200 | $115,100 | $183,100 |
| 2024 | $1,878 | $281,000 | $105,600 | $175,400 |
| 2023 | $1,954 | $276,700 | $100,400 | $176,300 |
| 2022 | $2,030 | $286,000 | $98,400 | $187,600 |
| 2021 | $1,740 | $220,600 | $86,200 | $134,400 |
| 2020 | $1,697 | $201,200 | $63,700 | $137,500 |
| 2019 | $1,568 | $177,900 | $63,700 | $114,200 |
| 2018 | $1,435 | $170,300 | $63,700 | $106,600 |
| 2017 | $1,370 | $159,300 | $60,900 | $98,400 |
| 2016 | $1,261 | $137,900 | $60,900 | $77,000 |
| 2015 | $1,443 | $145,800 | $59,100 | $86,700 |
| 2014 | $1,352 | $139,000 | $57,300 | $81,700 |
Source: Public Records
Map
Nearby Homes
- 10282 S Zinnia Way
- 10165 S Zinnia Way
- 10109 S Peony Way
- 717 Sand Dollar Dr
- 10454 S Sand Dollar Dr
- 735 Sandy Point Dr
- 861 E 10515 S
- 941 E Carnation Dr
- 954 E Carnation Dr
- 959 E Violet Dr
- 601 E Pali St
- 932 E 10465 S
- 9996 S Opal Cir
- 956 E Sego Lily Dr
- 920 E Violet Cir
- 10433 S Carnation Dr
- 971 E 10600 S
- 10499 S Carnation Dr
- 1012 E Bell Dr
- 373 E 10450 S
- 10267 S Zinnia Way
- 10247 Zinnia Way
- 10267 Zinnia Way
- 10277 S Zinnia Way
- 10277 Zinnia Way
- 10237 Zinnia Way
- 10237 S Zinnia Way
- 758 E Delphinium Way
- 758 Delphinium Way
- 10264 Amaryllis Dr
- 10254 Amaryllis Dr
- 10287 S Zinnia Way
- 10262 S Zinnia Way
- 10287 Zinnia Way
- 10262 Zinnia Way
- 10274 S Amaryllis Dr
- 10227 S Zinnia Way
- 10274 Amaryllis Dr
- 10227 Zinnia Way
- 10272 Zinnia Way