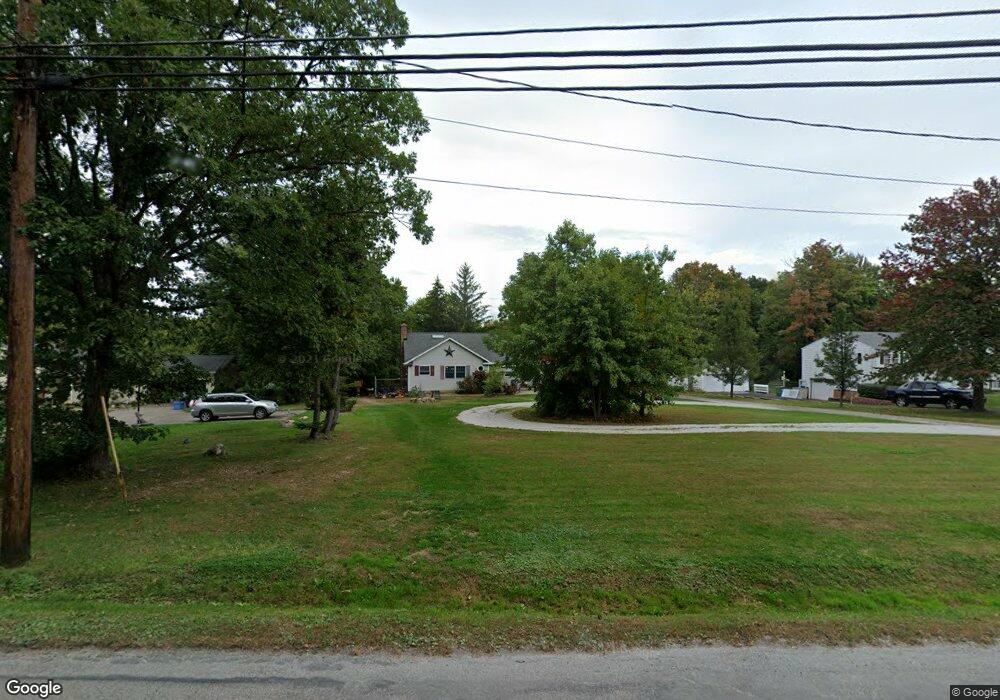
10259 Page Dr Concord Township, OH 44060
Estimated Value: $335,917 - $427,000
3
Beds
3
Baths
1,736
Sq Ft
$217/Sq Ft
Est. Value
About This Home
This home is located at 10259 Page Dr, Concord Township, OH 44060 and is currently estimated at $376,979, approximately $217 per square foot. 10259 Page Dr is a home located in Lake County with nearby schools including Henry F. Lamuth Middle School, Riverside Junior/Senior High School, and Hershey Montessori School PreK-Elementary.
Ownership History
Date
Name
Owned For
Owner Type
Purchase Details
Closed on
Feb 22, 2021
Sold by
Bode Douglas A and Bode Laura L
Bought by
Bode Douglas A and Bode Laura L
Current Estimated Value
Purchase Details
Closed on
Feb 22, 2019
Sold by
Bode Douglas A and Bode Laura L
Bought by
Bode Douglas A and Bode Laura L
Purchase Details
Closed on
Apr 19, 1999
Sold by
Larned Harold T and Larned Phyllis M
Bought by
Bode Douglas A and Bode Laura L
Home Financials for this Owner
Home Financials are based on the most recent Mortgage that was taken out on this home.
Original Mortgage
$132,000
Outstanding Balance
$33,425
Interest Rate
7.04%
Mortgage Type
Purchase Money Mortgage
Estimated Equity
$343,554
Purchase Details
Closed on
Jul 23, 1993
Bought by
Larned Harold T
Create a Home Valuation Report for This Property
The Home Valuation Report is an in-depth analysis detailing your home's value as well as a comparison with similar homes in the area
Home Values in the Area
Average Home Value in this Area
Purchase History
| Date | Buyer | Sale Price | Title Company |
|---|---|---|---|
| Bode Douglas A | -- | None Available | |
| Bode Douglas A | -- | None Available | |
| Bode Douglas A | $130,000 | Chicago Title Insurance Comp | |
| Larned Harold T | $129,000 | -- |
Source: Public Records
Mortgage History
| Date | Status | Borrower | Loan Amount |
|---|---|---|---|
| Open | Bode Douglas A | $132,000 |
Source: Public Records
Tax History Compared to Growth
Tax History
| Year | Tax Paid | Tax Assessment Tax Assessment Total Assessment is a certain percentage of the fair market value that is determined by local assessors to be the total taxable value of land and additions on the property. | Land | Improvement |
|---|---|---|---|---|
| 2024 | -- | $83,190 | $24,990 | $58,200 |
| 2023 | $7,178 | $74,320 | $19,960 | $54,360 |
| 2022 | $3,901 | $74,320 | $19,960 | $54,360 |
| 2021 | $3,916 | $74,320 | $19,960 | $54,360 |
| 2020 | $3,838 | $64,620 | $17,360 | $47,260 |
| 2019 | $3,632 | $61,260 | $14,000 | $47,260 |
| 2018 | $3,644 | $65,990 | $18,200 | $47,790 |
| 2017 | $4,133 | $65,990 | $18,200 | $47,790 |
| 2016 | $3,797 | $65,990 | $18,200 | $47,790 |
| 2015 | $3,559 | $65,990 | $18,200 | $47,790 |
| 2014 | $3,228 | $59,980 | $18,200 | $41,780 |
| 2013 | $3,228 | $59,980 | $18,200 | $41,780 |
Source: Public Records
Map
Nearby Homes
- 7945 Viewmount Dr
- 8150 Butler Hill Dr
- Promenade Plan at The Villas at Canterwood Farms
- Palazzo Plan at The Villas at Canterwood Farms
- Torino Plan at The Villas at Canterwood Farms
- Portico Plan at The Villas at Canterwood Farms
- Verona Plan at The Villas at Canterwood Farms
- 7880 Oakridge Dr
- 8220 Hermitage Rd
- 7751 Mountain Ash Dr
- 7460 Thatchum Ln
- 7731 Mountain Ash Dr
- 8225 Eagle Ridge Dr
- 10235 Hoose Rd
- 8059 N Chariot St
- 7680 Mountain Ash Dr
- 7579 Mountain Park Dr
- 9755 Ridgeview Trail
- 7561 Hermitage Rd
- 7300 Morley Rd
- 10271 Page Dr
- 10279 Page Dr
- 10245 Page Dr
- 10235 Page Dr
- 0 Page Dr Unit 3762976
- 10268 Page Dr
- 10250 Page Dr
- 10270 Page Dr
- 10281 Page Dr
- 10224 Page Dr
- 10280 Page Dr
- 10311 Page Dr
- 10210 Page Dr
- 10294 Page Dr
- 10211 Page Dr
- 7910 Viewmount Dr
- 10325 Page Dr
- 10251 Karaboo Trail
- 10251 Karaboo Trail Unit SL 67
- 10257 Karaboo Trail