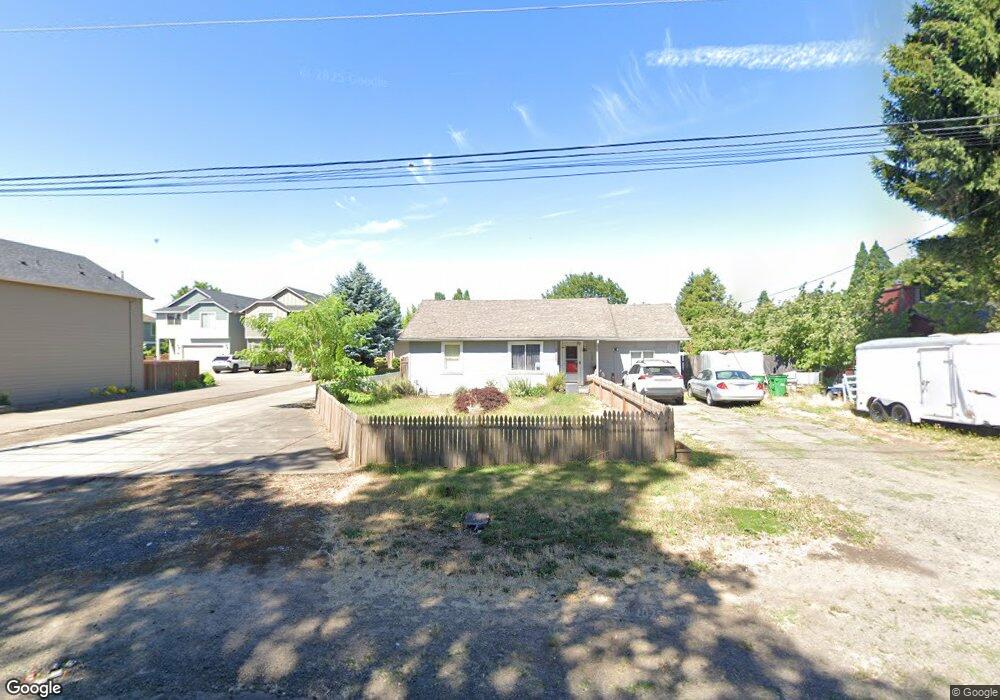
1026 Douglas St Forest Grove, OR 97116
Estimated Value: $449,000 - $581,000
3
Beds
2
Baths
1,280
Sq Ft
$384/Sq Ft
Est. Value
About This Home
This home is located at 1026 Douglas St, Forest Grove, OR 97116 and is currently estimated at $491,656, approximately $384 per square foot. 1026 Douglas St is a home with nearby schools including Joseph Gale Elementary School, Tom McCall Upper Elementary School, and Neil Armstrong Middle School.
Ownership History
Date
Name
Owned For
Owner Type
Purchase Details
Closed on
Sep 26, 2025
Sold by
Funk Merlin J and Funk Karen L
Bought by
Merlin And Karen Funk Living Trust and Funk
Current Estimated Value
Purchase Details
Closed on
Jul 3, 2013
Sold by
Funk Merlin and Funk Karen L
Bought by
Funk Merlin J and Funk Karen L
Home Financials for this Owner
Home Financials are based on the most recent Mortgage that was taken out on this home.
Original Mortgage
$108,500
Interest Rate
3.57%
Mortgage Type
New Conventional
Purchase Details
Closed on
Dec 26, 2012
Sold by
Lee Devries Llc
Bought by
Funk Merlin and Funk Karen L
Purchase Details
Closed on
Oct 19, 2011
Sold by
Rydman David G and Rydman Rachel M
Bought by
Lee Devries Llc
Create a Home Valuation Report for This Property
The Home Valuation Report is an in-depth analysis detailing your home's value as well as a comparison with similar homes in the area
Home Values in the Area
Average Home Value in this Area
Purchase History
| Date | Buyer | Sale Price | Title Company |
|---|---|---|---|
| Merlin And Karen Funk Living Trust | -- | None Listed On Document | |
| Funk Merlin J | -- | First American | |
| Funk Merlin | $45,000 | First American | |
| Lee Devries Llc | -- | Fatco |
Source: Public Records
Mortgage History
| Date | Status | Borrower | Loan Amount |
|---|---|---|---|
| Previous Owner | Funk Merlin J | $108,500 |
Source: Public Records
Tax History Compared to Growth
Tax History
| Year | Tax Paid | Tax Assessment Tax Assessment Total Assessment is a certain percentage of the fair market value that is determined by local assessors to be the total taxable value of land and additions on the property. | Land | Improvement |
|---|---|---|---|---|
| 2026 | $4,964 | $278,770 | -- | -- |
| 2025 | $4,964 | $270,660 | -- | -- |
| 2024 | $4,789 | $262,780 | -- | -- |
| 2023 | $4,789 | $255,130 | $0 | $0 |
| 2022 | $4,188 | $255,130 | $0 | $0 |
| 2021 | $4,133 | $240,490 | $0 | $0 |
| 2020 | $4,111 | $233,490 | $0 | $0 |
| 2019 | $4,019 | $226,690 | $0 | $0 |
| 2018 | $3,896 | $220,090 | $0 | $0 |
| 2017 | $3,776 | $213,680 | $0 | $0 |
| 2016 | $3,669 | $207,460 | $0 | $0 |
| 2015 | $3,528 | $201,420 | $0 | $0 |
| 2014 | $3,511 | $195,560 | $0 | $0 |
Source: Public Records
Map
Nearby Homes