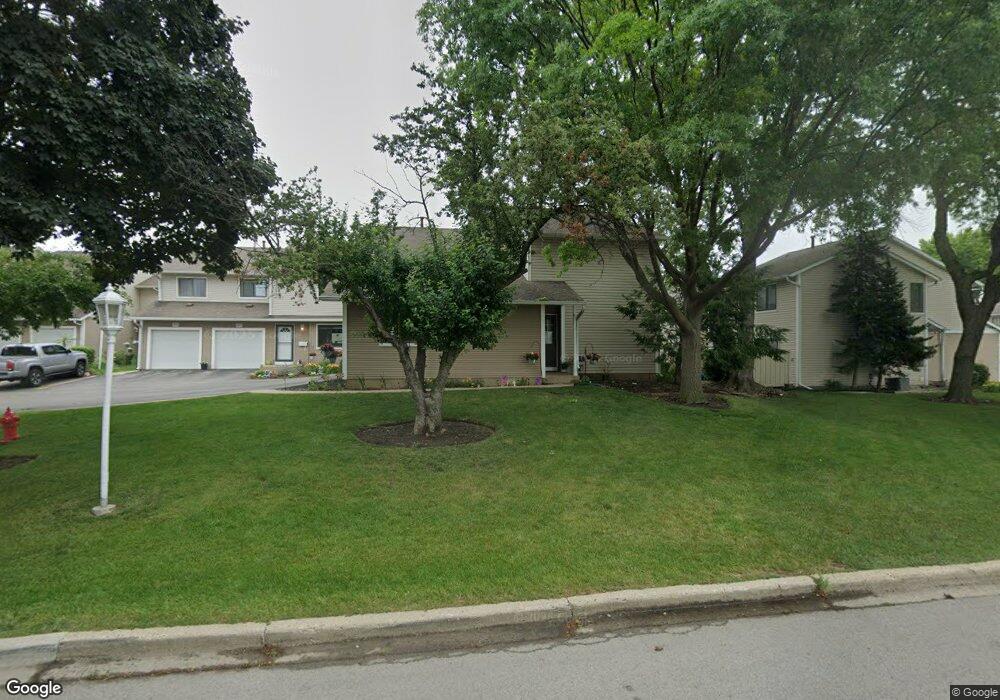
1026 E Cunningham Dr Palatine, IL 60074
Virginia Lake NeighborhoodEstimated Value: $306,000 - $332,088
4
Beds
3
Baths
1,708
Sq Ft
$187/Sq Ft
Est. Value
About This Home
This home is located at 1026 E Cunningham Dr, Palatine, IL 60074 and is currently estimated at $318,772, approximately $186 per square foot. 1026 E Cunningham Dr is a home located in Cook County with nearby schools including Virginia Lake Elementary School, Palatine High School, and St Thomas Of Villanova School.
Ownership History
Date
Name
Owned For
Owner Type
Purchase Details
Closed on
Apr 20, 2006
Sold by
Lopez Sergio and Lopez Del Maria Carmen
Bought by
Lopez Sergio and Lopez Maria Delcarmen
Current Estimated Value
Purchase Details
Closed on
Oct 24, 2002
Sold by
Hassett Shaun M and Hassett Valerie J
Bought by
Lopez Sergio
Home Financials for this Owner
Home Financials are based on the most recent Mortgage that was taken out on this home.
Original Mortgage
$190,890
Outstanding Balance
$77,584
Interest Rate
6.13%
Mortgage Type
FHA
Estimated Equity
$241,188
Purchase Details
Closed on
Apr 4, 1994
Sold by
Anderson Jay Dee and Anderson Ora Jean
Bought by
Hassett Shaun M and Hassett Valerie J
Home Financials for this Owner
Home Financials are based on the most recent Mortgage that was taken out on this home.
Original Mortgage
$126,125
Interest Rate
8.5%
Mortgage Type
FHA
Create a Home Valuation Report for This Property
The Home Valuation Report is an in-depth analysis detailing your home's value as well as a comparison with similar homes in the area
Home Values in the Area
Average Home Value in this Area
Purchase History
| Date | Buyer | Sale Price | Title Company |
|---|---|---|---|
| Lopez Sergio | -- | None Available | |
| Lopez Sergio | $198,000 | -- | |
| Hassett Shaun M | $127,500 | -- |
Source: Public Records
Mortgage History
| Date | Status | Borrower | Loan Amount |
|---|---|---|---|
| Open | Lopez Sergio | $190,890 | |
| Previous Owner | Hassett Shaun M | $126,125 |
Source: Public Records
Tax History
| Year | Tax Paid | Tax Assessment Tax Assessment Total Assessment is a certain percentage of the fair market value that is determined by local assessors to be the total taxable value of land and additions on the property. | Land | Improvement |
|---|---|---|---|---|
| 2025 | $5,828 | $31,000 | $4,488 | $26,512 |
| 2024 | $5,828 | $23,000 | $4,000 | $19,000 |
| 2023 | $5,608 | $23,000 | $4,000 | $19,000 |
| 2022 | $5,608 | $23,000 | $4,000 | $19,000 |
| 2021 | $4,466 | $17,082 | $1,122 | $15,960 |
| 2020 | $4,472 | $17,082 | $1,122 | $15,960 |
| 2019 | $4,490 | $19,086 | $1,122 | $17,964 |
| 2018 | $5,242 | $20,302 | $1,009 | $19,293 |
| 2017 | $5,161 | $20,302 | $1,009 | $19,293 |
| 2016 | $5,049 | $20,302 | $1,009 | $19,293 |
| 2015 | $3,594 | $14,322 | $897 | $13,425 |
| 2014 | $3,983 | $15,693 | $897 | $14,796 |
| 2013 | $4,742 | $18,662 | $897 | $17,765 |
Source: Public Records
Map
Nearby Homes
- 1351 N Winslowe Dr Unit 302
- 1132 E Randville Dr Unit 2H
- 1150 E Randville Dr Unit 1N
- 1344 N Winslowe Dr
- 1493 N Winslowe Dr Unit 204
- 1313 N Baldwin Ct Unit 2C
- 1316 E Evergreen Dr Unit 7
- 1275 E Baldwin Ln Unit 408
- 1426 E Ports o Call Dr
- 1235 Wyndham Ct Unit 203
- 1255 Wyndham Dr Unit 201
- 1337 E Wyndham Cir Unit 208
- 2500 Bayside Dr Unit 3
- 1129 N Claremont Dr Unit 1627
- 915 N Saratoga Dr
- 1000 Bayside Dr Unit 207
- 1239 E Carpenter Dr
- 3000 Bayside Dr Unit 107
- 3000 Bayside Dr Unit 202
- 820 N Sanborn Dr
- 1022 E Cunningham Dr
- 1020 E Cunningham Dr
- 1028 E Randville Dr
- 1030 E Randville Dr
- 1032 E Randville Dr
- 1018 E Cunningham Dr
- 1016 E Cunningham Dr
- 1036 E Randville Dr
- 1014 E Cunningham Dr
- 1048 E Randville Dr
- 1050 E Randville Dr
- 1012 E Cunningham Dr
- 1046 E Randville Dr
- 1038 E Randville Dr
- 1001 E Meadow Lake Dr
- 1052 E Randville Dr
- 1044 E Randville Dr
- 1040 E Randville Dr
- 1054 E Randville Dr