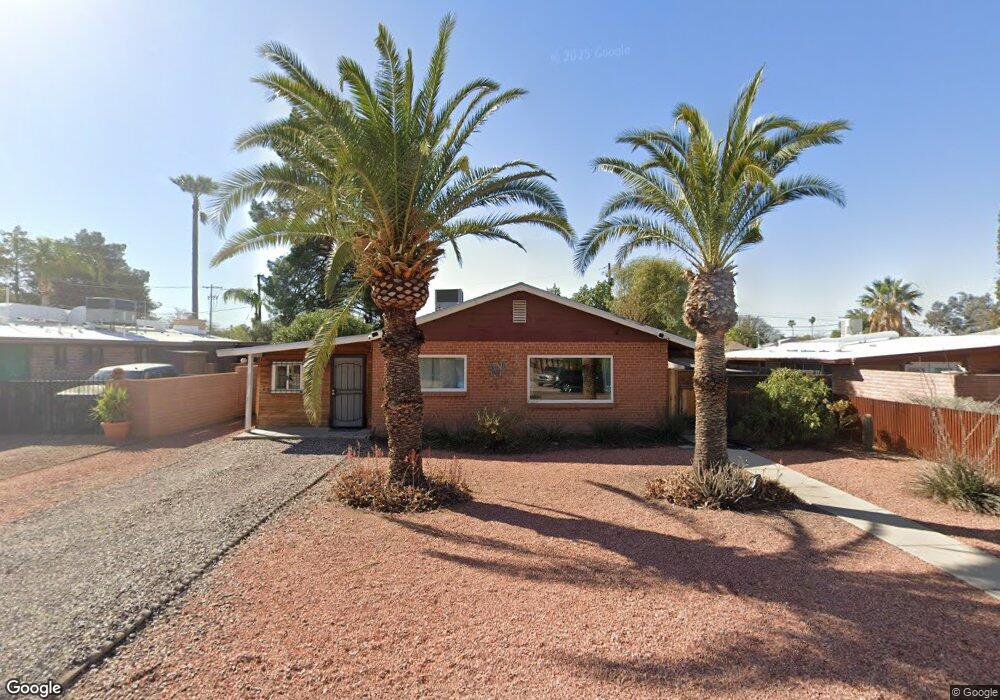
1026 E Windsor St Tucson, AZ 85719
Mountain View NeighborhoodEstimated Value: $260,000 - $296,000
Studio
2
Baths
988
Sq Ft
$280/Sq Ft
Est. Value
About This Home
This home is located at 1026 E Windsor St, Tucson, AZ 85719 and is currently estimated at $276,689, approximately $280 per square foot. 1026 E Windsor St is a home located in Pima County with nearby schools including Frances Owen Holaway Elementary School, Amphitheater Middle School, and Amphitheater High School.
Ownership History
Date
Name
Owned For
Owner Type
Purchase Details
Closed on
Mar 23, 2022
Sold by
Warner Daryl M and Warner Malisse J
Bought by
Bass Shelby R
Current Estimated Value
Home Financials for this Owner
Home Financials are based on the most recent Mortgage that was taken out on this home.
Original Mortgage
$230,743
Outstanding Balance
$214,034
Interest Rate
3.92%
Mortgage Type
FHA
Estimated Equity
$62,655
Purchase Details
Closed on
Mar 27, 2007
Sold by
Mayo Darel Ray and Mayo Cynthia D
Bought by
Warner Daryl M and Warner Malisse J
Purchase Details
Closed on
Apr 19, 2004
Sold by
Mayo Cynthia D and Hogan Cynthia D
Bought by
Mayo Darel Ray and Mayo Cynthia D
Create a Home Valuation Report for This Property
The Home Valuation Report is an in-depth analysis detailing your home's value as well as a comparison with similar homes in the area
Home Values in the Area
Average Home Value in this Area
Purchase History
| Date | Buyer | Sale Price | Title Company |
|---|---|---|---|
| Bass Shelby R | $235,000 | None Listed On Document | |
| Bass Shelby R | $235,000 | None Listed On Document | |
| Bass Shelby R | $235,000 | None Listed On Document | |
| Warner Daryl M | $165,000 | Ttise | |
| Mayo Darel Ray | -- | Lawyers Title Of Arizona Inc |
Source: Public Records
Mortgage History
| Date | Status | Borrower | Loan Amount |
|---|---|---|---|
| Open | Bass Shelby R | $230,743 | |
| Closed | Bass Shelby R | $230,743 |
Source: Public Records
Tax History
| Year | Tax Paid | Tax Assessment Tax Assessment Total Assessment is a certain percentage of the fair market value that is determined by local assessors to be the total taxable value of land and additions on the property. | Land | Improvement |
|---|---|---|---|---|
| 2026 | $1,211 | $11,833 | -- | -- |
| 2025 | $1,211 | $11,270 | -- | -- |
| 2024 | $1,165 | $10,733 | -- | -- |
| 2023 | $1,126 | $10,222 | $0 | $0 |
| 2022 | $1,116 | $9,735 | $0 | $0 |
| 2021 | $1,101 | $8,830 | $0 | $0 |
| 2020 | $1,095 | $8,830 | $0 | $0 |
| 2019 | $1,065 | $9,932 | $0 | $0 |
| 2018 | $1,028 | $7,628 | $0 | $0 |
| 2017 | $1,010 | $7,628 | $0 | $0 |
| 2016 | $952 | $7,265 | $0 | $0 |
| 2015 | $928 | $6,919 | $0 | $0 |
Source: Public Records
Map
Nearby Homes
- 1081 E Ascent St
- 1121 E Ascent St
- 3502 N Santa Rita Ave
- 908 E Graybill Dr
- 905 E Prince Rd
- 1114 E Descent St
- 1010 E Gifford Dr
- 802 E Graybill Dr
- 3701 N Park Ave
- 842 E Freeman Place
- 1110 E Halcyon Rd
- 3309 N Tyndall Ave
- 933 E Mesquite Dr
- 905 E Mesquite Dr Unit 2
- 1135 E Smoot Dr
- 1515 E Kleindale Rd
- 508 E Joan St
- 1521 E Prince Rd
- 3865 N Sieg Ave
- 1585 E Prince Rd
- 1018 E Windsor St
- 1034 E Windsor St
- 1010 E Windsor St
- 1025 E Greenlee Place
- 1033 E Greenlee Place
- 1017 E Greenlee Place
- 1017 E Windsor St
- 1033 E Windsor St
- 1002 E Windsor St
- 1009 E Windsor St
- 3517 N Olive Rd
- 3509 N Olive Rd
- 3525 N Olive Rd
- 1001 E Windsor St
- 1009 E Greenlee Place
- 3533 N Olive Rd
- 3501 N Olive Rd
- 1026 E Greenlee Place
- 1018 E Prince Rd
- 1034 E Greenlee Place
Your Personal Tour Guide
Ask me questions while you tour the home.