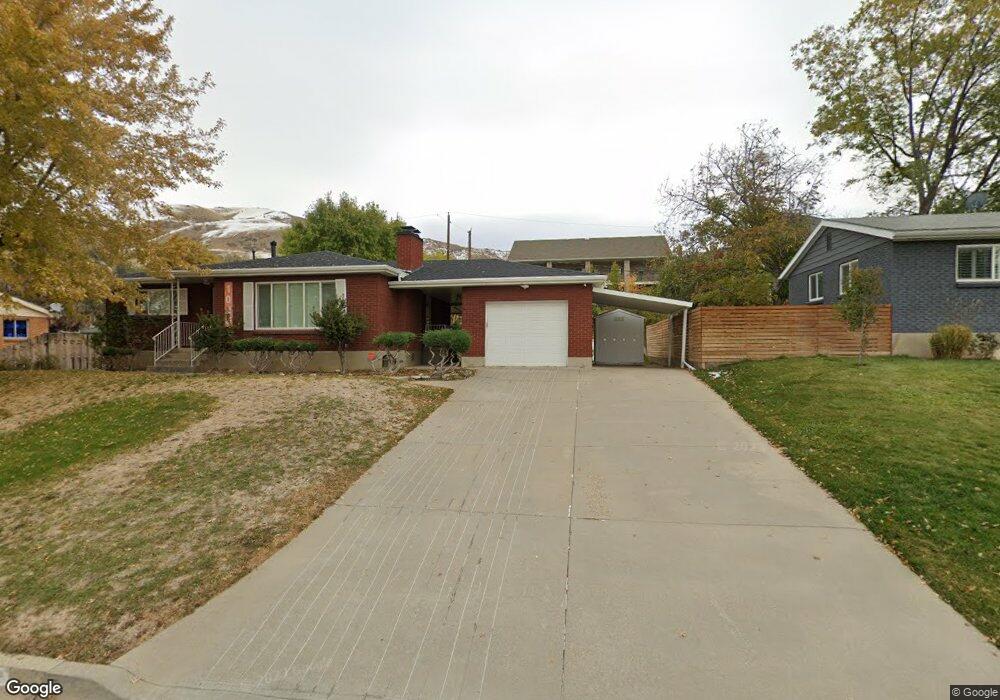
1026 N 650 E Bountiful, UT 84010
Estimated Value: $472,000 - $588,000
2
Beds
2
Baths
1,030
Sq Ft
$506/Sq Ft
Est. Value
About This Home
This home is located at 1026 N 650 E, Bountiful, UT 84010 and is currently estimated at $521,286, approximately $506 per square foot. 1026 N 650 E is a home located in Davis County with nearby schools including Tolman School, Bountiful Junior High School, and Viewmont High School.
Ownership History
Date
Name
Owned For
Owner Type
Purchase Details
Closed on
Feb 15, 2022
Sold by
Odle Ratcliffe Danettta Lea
Bought by
Danetta L Ratclffe Trust
Current Estimated Value
Home Financials for this Owner
Home Financials are based on the most recent Mortgage that was taken out on this home.
Original Mortgage
$283,300
Outstanding Balance
$262,596
Interest Rate
3.56%
Mortgage Type
New Conventional
Estimated Equity
$258,690
Purchase Details
Closed on
Nov 18, 2020
Sold by
Racliffe Danetta Lea and Racliffe Danetta L
Bought by
Racliffe Danetta L and The Danetta L Ratcliffe Trust
Create a Home Valuation Report for This Property
The Home Valuation Report is an in-depth analysis detailing your home's value as well as a comparison with similar homes in the area
Purchase History
| Date | Buyer | Sale Price | Title Company |
|---|---|---|---|
| Danetta L Ratclffe Trust | -- | -- | |
| Thompson Roger M | -- | First American Title | |
| Racliffe Danetta L | -- | None Available |
Source: Public Records
Mortgage History
| Date | Status | Borrower | Loan Amount |
|---|---|---|---|
| Open | Thompson Roger M | $283,300 |
Source: Public Records
Tax History
| Year | Tax Paid | Tax Assessment Tax Assessment Total Assessment is a certain percentage of the fair market value that is determined by local assessors to be the total taxable value of land and additions on the property. | Land | Improvement |
|---|---|---|---|---|
| 2025 | $4,691 | $439,000 | $236,538 | $202,462 |
| 2024 | $4,450 | $235,949 | $120,005 | $115,944 |
| 2023 | $4,288 | $226,600 | $119,261 | $107,338 |
| 2022 | $4,524 | $238,700 | $115,360 | $123,340 |
| 2021 | $2,195 | $311,000 | $171,394 | $139,606 |
| 2020 | $1,939 | $275,000 | $156,080 | $118,920 |
| 2019 | $1,962 | $272,000 | $155,429 | $116,571 |
| 2018 | $1,815 | $247,000 | $144,156 | $102,844 |
| 2016 | $1,576 | $116,160 | $45,356 | $70,804 |
| 2015 | $1,563 | $108,845 | $45,356 | $63,489 |
| 2014 | $1,571 | $112,864 | $45,356 | $67,508 |
| 2013 | -- | $99,281 | $43,945 | $55,336 |
Source: Public Records
Map
Nearby Homes
- 662 E 1200 N
- 975 E 1050 N
- 1023 E 800 N
- 453 N 400 E Unit 7-D
- 610 E Pages Ln
- 908 Northern Hills Dr Unit 3
- 1105 E 600 N
- 345 N 400 E
- 933 Northern Hills Cir
- 683 E 100 N
- 1420 N Main St
- 967 S Courtyard Ln
- 1342 Northridge Dr
- 49 E 200 N Unit 4
- 610 S 800 E
- 41 E 200 N Unit 6
- 55 E 200 N Unit 2
- 51 E 200 N Unit 3
- 256 N Main St
- 254 N Main St
Your Personal Tour Guide
Ask me questions while you tour the home.