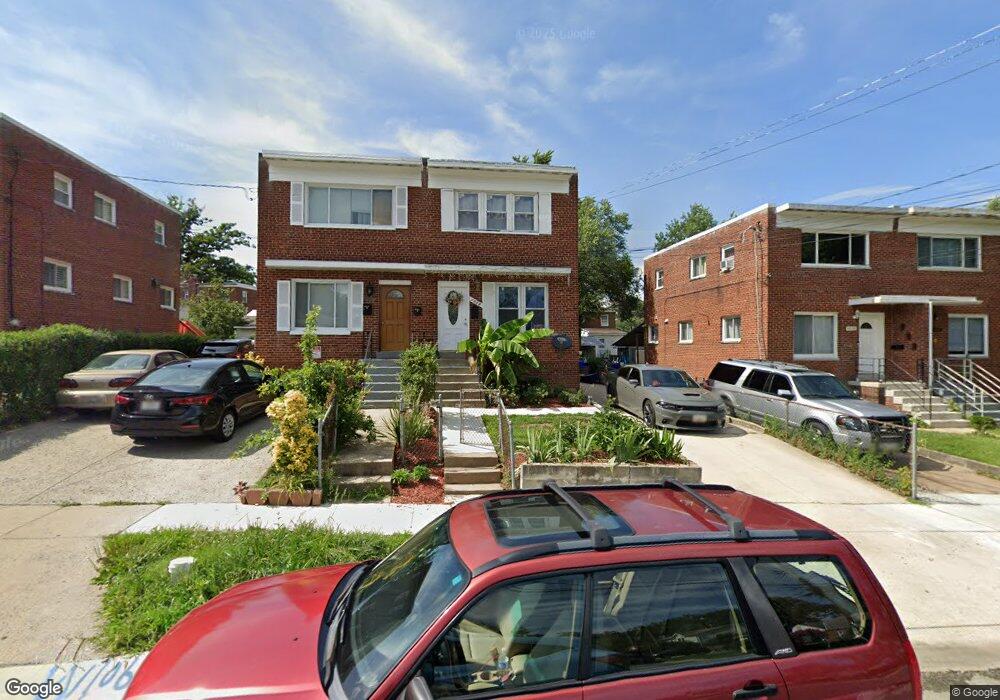
1026 Osage St Silver Spring, MD 20903
Silver Spring Park NeighborhoodEstimated Value: $106,000 - $359,808
Studio
2
Baths
1,088
Sq Ft
$265/Sq Ft
Est. Value
About This Home
This home is located at 1026 Osage St, Silver Spring, MD 20903 and is currently estimated at $288,202, approximately $264 per square foot. 1026 Osage St is a home located in Montgomery County with nearby schools including New Hampshire Estates Elementary School, Oak View Elementary School, and Eastern Middle School.
Ownership History
Date
Name
Owned For
Owner Type
Purchase Details
Closed on
Mar 8, 2002
Sold by
Wells Fargo Home Mortg Inc
Bought by
Rodriquez Tomas M
Current Estimated Value
Purchase Details
Closed on
Aug 31, 2001
Sold by
Kanneh Claresa B
Bought by
Federal Home Loan Mortgage and Corporation
Purchase Details
Closed on
Dec 14, 1999
Sold by
Target Investment Group Inc
Bought by
Kanneh Claresa B
Create a Home Valuation Report for This Property
The Home Valuation Report is an in-depth analysis detailing your home's value as well as a comparison with similar homes in the area
Home Values in the Area
Average Home Value in this Area
Purchase History
| Date | Buyer | Sale Price | Title Company |
|---|---|---|---|
| Rodriquez Tomas M | $97,000 | -- | |
| Wells Fargo Home Mortg Inc | $97,000 | -- | |
| Federal Home Loan Mortgage | $115,000 | -- | |
| Kanneh Claresa B | $118,000 | -- | |
| Target Investment Group Inc | $80,000 | -- |
Source: Public Records
Tax History
| Year | Tax Paid | Tax Assessment Tax Assessment Total Assessment is a certain percentage of the fair market value that is determined by local assessors to be the total taxable value of land and additions on the property. | Land | Improvement |
|---|---|---|---|---|
| 2025 | $3,733 | $292,333 | -- | -- |
| 2024 | $3,733 | $271,100 | $120,000 | $151,100 |
| 2023 | $4,290 | $261,600 | $0 | $0 |
| 2022 | $2,032 | $252,100 | $0 | $0 |
| 2021 | $2,316 | $242,600 | $120,000 | $122,600 |
| 2020 | $2,316 | $224,133 | $0 | $0 |
| 2019 | $2,072 | $205,667 | $0 | $0 |
| 2018 | $1,766 | $187,200 | $99,000 | $88,200 |
| 2017 | $1,827 | $184,133 | $0 | $0 |
| 2016 | -- | $181,067 | $0 | $0 |
| 2015 | $1,619 | $178,000 | $0 | $0 |
| 2014 | $1,619 | $178,000 | $0 | $0 |
Source: Public Records
Map
Nearby Homes
- 8417 11th Ave
- 14 Seek Ct
- 8506 Glenville Rd
- 8403 Tahona Dr
- 805 Forston St
- 8404 12th Ave
- 8830 Piney Branch Rd Unit 1004
- 8830 Piney Branch Rd Unit 1202
- 8830 Piney Branch Rd Unit 401
- 717 Ludlow St
- 8422 12th Ave
- 8817 Glenville Rd
- 8103 Kennewick Ave
- 805 Langley Dr
- 8107 Chester St
- 8012 Barron St
- 8203 Greenwood Ave
- 7801 Lockney Ave
- 8509 Flower Ave
- 8511 Flower Ave
Your Personal Tour Guide
Ask me questions while you tour the home.